
Description
Overview
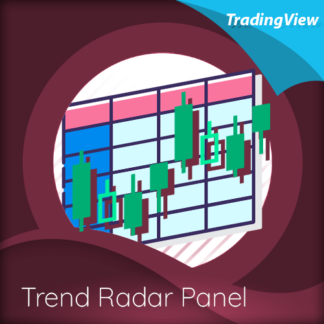
One of the biggest issues trading any market is in keeping track of trading opportunities as they arise across all the various timeframes without having multiple monitors or charts open and this is where the Radar Panel steps in. Using TradingView’s Table function, we have incorporated a host of our leading indicators on the panel which can be applied to any timeframe and from which you can instantly spot opportunities as they arise whether in terms of trend, reversals, volatility, or volume. In addition, when using a scanner such as this, it also highlights broad sentiment if, for example, you have added currency pairs from the same matrix or a group of stocks from the same sector. And you can of course have multiples open across the various timeframes.
The Quantum Trends Radar Panel is a powerful indicator that keeps track of indicator signals of up to 10 different symbols in real time. For each symbol, it can display the current signals of 2 Quantum Trading trend indicators namely:
- Quantum Trends
- Quantum Trend Monitor
It can also display the current Open, High, Low, and Close prices of each symbol. Each indicator has 1 or more columns allotted to them to display information about their respective signals. Below we will discuss what each indicator does and how it displays its signals in the Radar Panel.
Trends
All traders know that price is a leading indicator. Yet few traders ever discover how to correctly interpret the start of a new trend, or indeed the end of an old one. To add further complexity, markets spend over 70% of their time in congestion, moving sideways in a narrow range. The traders worst enemy.
What’s the answer? Step forward – the Quantum Trends indicator. With this simple and elegant indicator, dynamic trends are painted for you instantly and dynamically, in real time. In trading any market, you need to be quick on your feet, and the Quantum Trends indicator delivers in spades! But even better, not only will it signal your possible entry and exit, but it also signals a market in congestion – equally important. Knowing when to stay out, is just as important as knowing when to get in.
In the Radar Panel, the Trends indicator displays where the last trend dot is heading and the sentiment of the dot or the trend direction.
Columns
- Dot – this column displays whether the current trend dot is going upwards, downwards, or sideways
- Trend Direction – this column displays the sentiment of the current trend dot and its color
Trend Monitor
One of the hardest things to do in trading, is to stay in, and take the maximum profit from any position. You know how it goes. You get in and all is going well. Then the market reverses. You get frightened, and close out. What happens next?
Yes, you guessed it – the market reverses again and starts to move fast. Now it’s too late. You have missed out on some great profits, and are left wishing you had stayed in.
That’s why we developed the Quantum Trend Monitor. It does just that. It monitors the strength of the trend. It will help you stay in, when your emotion is telling you to get out. The Trend Monitor will give you the confidence, not just to stay in, but to take the maximum profit from each and every trade.
In the Radar Panel, the Trend Monitor indicator displays where the trend line (one of Trend Monitor’s 2 modes) is heading at and the current sentiment or trend direction.
Columns
- Trend Line – in the indicator proper, the trend line shows the progression or steepness of the trend’s momentum, and this information is simplified as the direction of the line, whether it is going upwards, downwards, or sideways.
- Trend Direction – this column displays the current sentiment and its color
OHLC Prices
Apart from the 2 Quantum indicators, the Radar Panel also displays the current OHLC prices of each symbol.
- Open
- High
- Low
- Close
Their color changes depending on the current price action.
With the portability of the TradingView platform, having the Radar Panel in your set of tools truly puts all the power of the Quantum trend indicators right at your fingertips. Get yours now.