
Description
One of the biggest issues trading any market is in keeping track of trading opportunities as they arise across all the various timeframes without having multiple monitors or charts open and this is where the Radar Panel steps in. Using TradingView’s Table function, we have incorporated a host of our leading indicators on the panel which can be applied to any timeframe and from which you can instantly spot opportunities as they arise whether in terms of trend, reversals, volatility, or volume. In addition, when using a scanner such as this, it also highlights broad sentiment if, for example, you have added currency pairs from the same matrix or a group of stocks from the same sector. And you can of course have multiples open across the various timeframes.
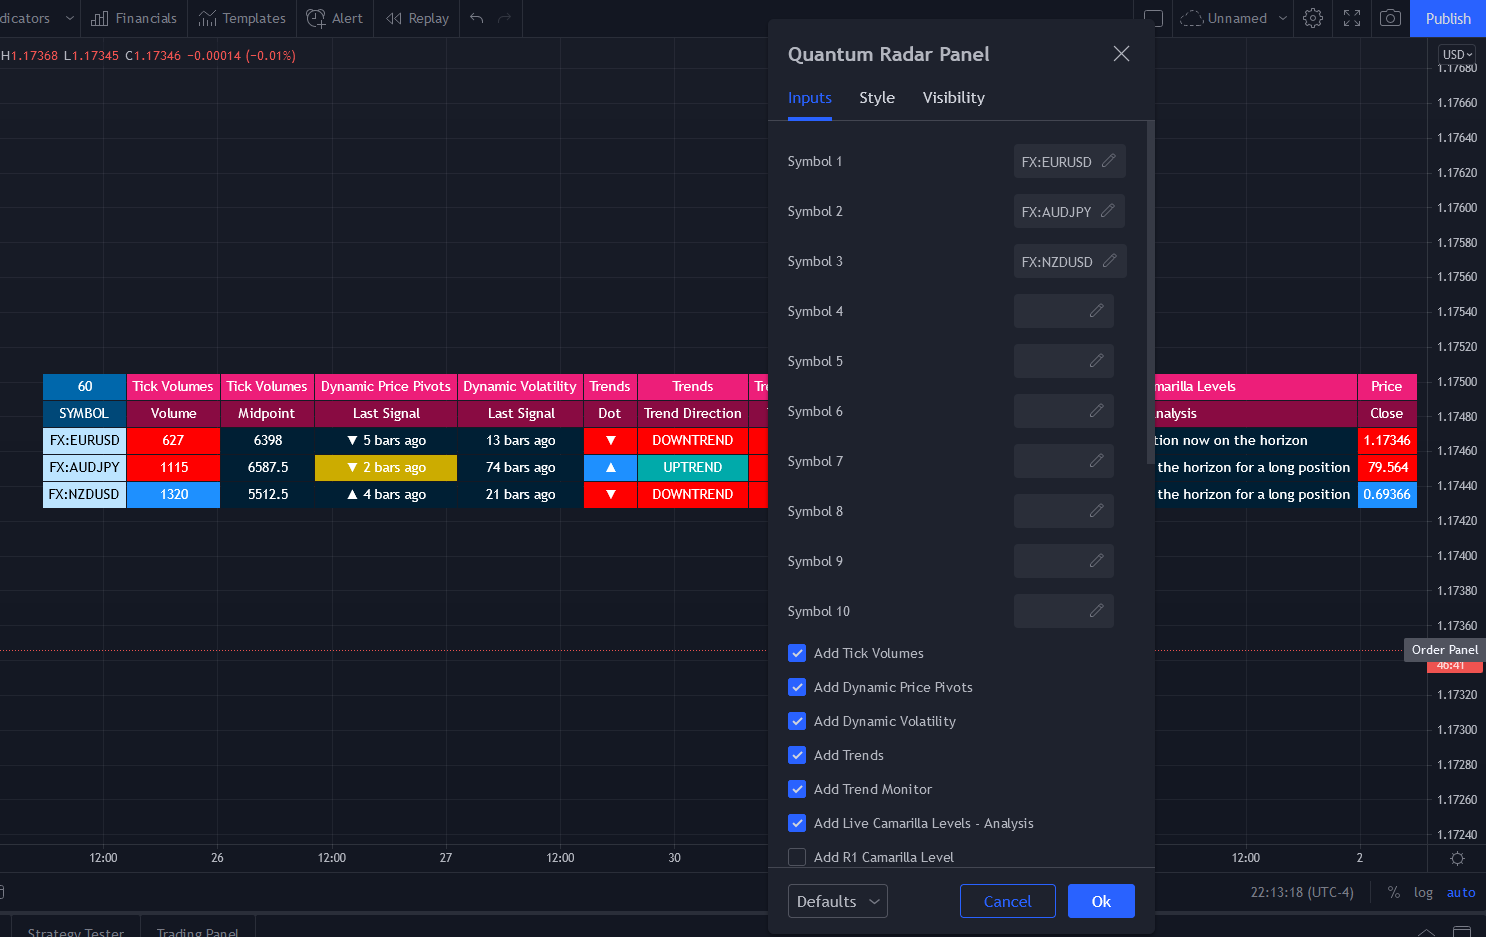
The Quantum Radar Panel is a powerful indicator that keeps track of indicator signals of up to 10 different symbols in real time. For each symbol, it can display the current signals of 6 Quantum Trading indicators namely:
- Quantum Tick Volumes
- Quantum Dynamic Price Pivots
- Quantum Dynamic Volatility
- Quantum Trends
- Quantum Trend Monitor
- Quantum Live Camarilla Levels
It can also display the current Open, High, Low, and Close prices of each symbol. Each indicator has 1 or more columns allotted to them to display information about their respective signals. Below we will discuss what each indicator does and how it displays its signals in the Radar Panel.
Tick Volumes
Volume is a powerful leading indicator, yet few traders ever take advantage of its awesome power. Why? Because identifying volume trends using the standard indicator can be confusing, and judging volume height even more so!
The Quantum Tick Volumes indicator takes a simple tool and makes it come to life! First, it paints the volume bar to match the candle. This makes it quick and easy to identify buying and selling volume with the associated price action.
Second, the Quantum Tick Volume indicator displays a dynamic mid-point, instantly telling you whether volumes are high, average or low in the session. No more guesswork! Volume analysis made simple – making it easy to spot profitable trading opportunities – fast!
In the Radar Panel, the Tick Volumes indicator displays 2 columns -Volume and Midpoint.
Columns
- Volume – this column displays the current volume of the symbol and changes colors according to the sentiment of the current candle.
- Midpoint – this column displays half of the highest volume bar within the current day and it is visible in intraday timeframes only
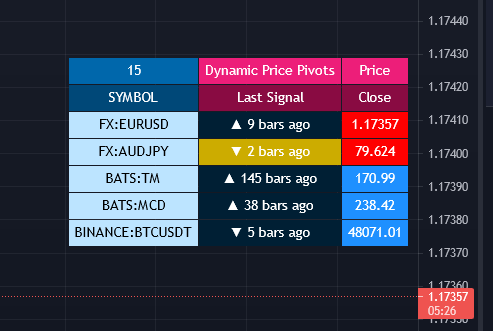
Dynamic Price Pivots
The Quantum Dynamic Price Pivots indicator could best be described as the Swiss army knife of trading. Power, simplicity and functionality all in one tool. Many traders struggle to identify reversal points based on price action alone. Why? Because you need to have a complete understanding of candlesticks, candles and candle patterns.
The dynamic pivot appears once a three-candle price pattern is created. This is one of the first signs of a possible change in sentiment, based on the price action alone. A pivot high in an uptrend, and pivot low in a down trend. So, whether you are trading long or short, the Quantum Dynamic Price Pivots indicator will instantly give you a visual signal to – pay attention! Powerful, yet so simple, and two indicators in one!
In the Radar Panel, the Dynamic Price Pivots indicator displays the last signal (isolated high or isolated low) and the number of bars since it was last seen.
Column
- Last Signal – this column displays the last pivot arrow that appeared in the chart in the form of an upward (isolated low) or downward (isolated high) arrow and the number of bars since it was detected. The cell turns yellow when the arrow is seen in the last 3 bars or less.
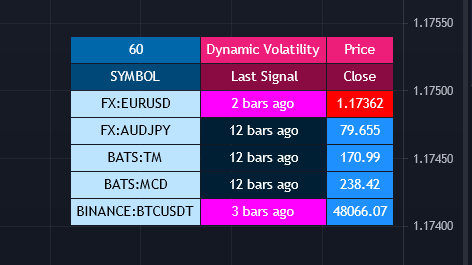
Dynamic Volatility
Volatility can be both good and bad. Great for making money fast. Not so good when you’re on the losing side! But how do you know when a market is volatile. Is the price action you are seeing normal for that currency pair? And more importantly, what is normal?
The Quantum Dynamic Volatility indicator is designed with one objective in mind. To show you, dynamically volatile price action. You then decide, based on the price action, whether to wait, or take advantage. One of the hardest things to learn in trading, is when to stay out. The Quantum Dynamic Volatility indicator makes this child’s play – keep you safe. It could almost be called your safety belt!
In the Radar Panel, the Dynamic Volatility indicator displays the number of bars since a volatile candle was last seen.
Column
- Last Signal – this column displays the number of bars since a volatile candle was detected. The cell turns magenta when the signal is seen in the last 3 bars or less.
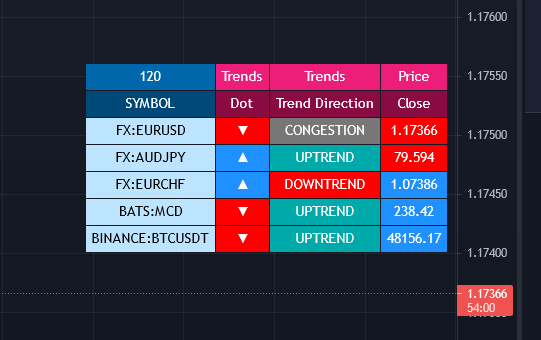
Trends
All traders know that price is a leading indicator. Yet few traders ever discover how to correctly interpret the start of a new trend, or indeed the end of an old one. To add further complexity, markets spend over 70% of their time in congestion, moving sideways in a narrow range. The traders worst enemy.
What’s the answer? Step forward – the Quantum Trends indicator. With this simple and elegant indicator, dynamic trends are painted for you instantly and dynamically, in real time. In trading any market, you need to be quick on your feet, and the Quantum Trends indicator delivers in spades! But even better, not only will it signal your possible entry and exit, but it also signals a market in congestion – equally important. Knowing when to stay out, is just as important as knowing when to get in.
In the Radar Panel, the Trends indicator displays where the last trend dot is heading and the sentiment of the dot or the trend direction.
Columns
- Dot – this column displays whether the current trend dot is going upwards, downwards, or sideways
- Trend Direction – this column displays the sentiment of the current trend dot and its color
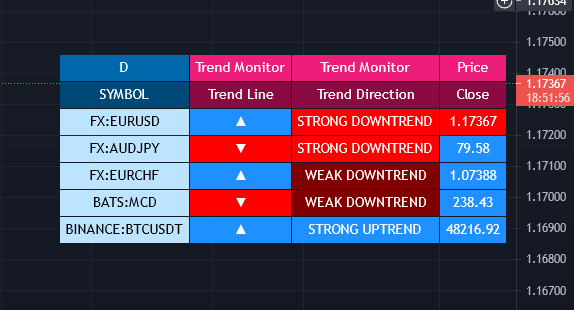
Trend Monitor
One of the hardest things to do in trading, is to stay in, and take the maximum profit from any position. You know how it goes. You get in and all is going well. Then the market reverses. You get frightened, and close out. What happens next?
Yes, you guessed it – the market reverses again and starts to move fast. Now it’s too late. You have missed out on some great profits, and are left wishing you had stayed in.
That’s why we developed the Quantum Trend Monitor. It does just that. It monitors the strength of the trend. It will help you stay in, when your emotion is telling you to get out. The Trend Monitor will give you the confidence, not just to stay in, but to take the maximum profit from each and every trade.
In the Radar Panel, the Trend Monitor indicator displays where the trend line (one of Trend Monitor’s 2 modes) is heading at and the current sentiment or trend direction.
Columns
- Trend Line – in the indicator proper, the trend line shows the progression or steepness of the trend’s momentum, and this information is simplified as the direction of the line, whether it is going upwards, downwards, or sideways.
- Trend Direction – this column displays the current sentiment and its color
Live Camarilla Levels
What is the Camarilla protocol, how does it work and what will it do for me?
Put simply it is a chameleon of an indicator and will appeal whether you are a more discretionary type of trader, making and taking decisions yourself, or if you prefer a more systematic or mechanical approach often associated with an EA for example. With the Camarilla levels indicator both approaches can be embraced and accommodated.
The Camarilla protocol has its roots in the open outcry trading pits, where traders considered floor pivots an essential tool. Based on these original ideas and incorporating the Camarilla equation we have developed a unique indicator which delivers clear and precise price-based support and resistance levels, which act as targets for profits, triggers for potential reversals, signals for possible breakouts, and finally stop loss placement. So, if you’re a swing or reversal trader, it’s the perfect indicator. Equally if you prefer breakout trading, again it’s the perfect indicator. And all with predetermined and clear levels for any price objectives and profit targets, with stop loss placement covered also.
In other words, a complete indicator, and one which is delivered with potential trading setups built in to help you see when key levels are being approached or breached. And to help you further when using the indicator, we have also included some simple messages to guide you as the various levels are approached and tested.
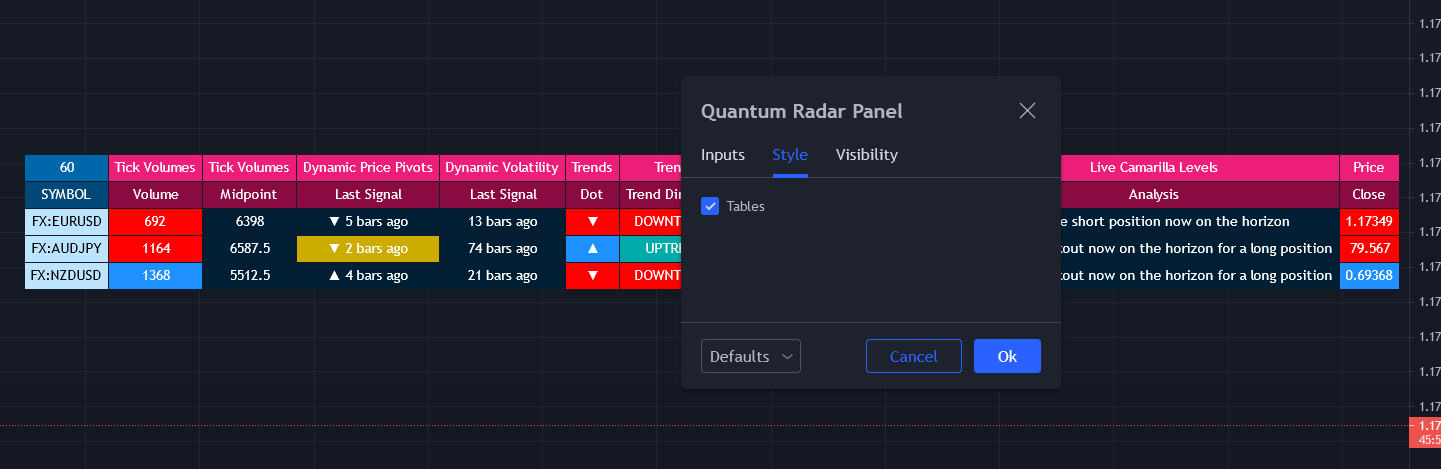
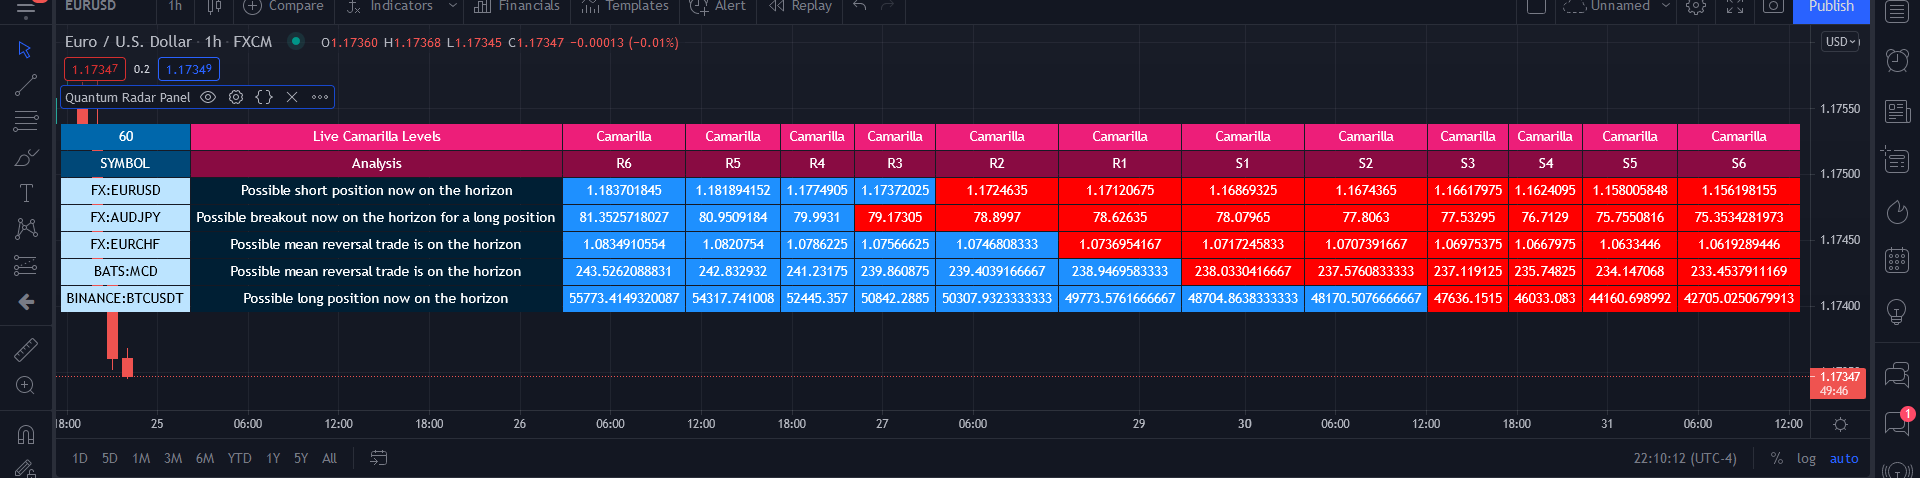
In the Radar Panel, the Live Camarilla Levels indicator displays the 12 Camarilla levels in descending order, R6 to R1 and S1 to S6, as well as the Analysis based on where the current price is situated among the 12 levels.
Columns
- Analysis – this column displays messages that can guide you as the various levels are approached and tested.
- R6 – R1, S1 – S6 (12 columns) – these columns display the 12 Camarilla levels calculated for the current timeframe and each one changes colors depending on the current price
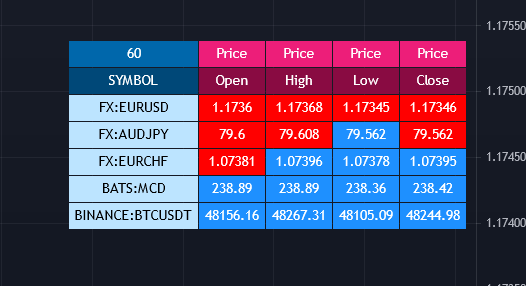
OHLC Prices
Apart from the 6 Quantum indicators, the Radar Panel also displays the current OHLC prices of each symbol.
- Open
- High
- Low
- Close
Their color changes depending on the current price action.
With the portability of the TradingView platform, having the Radar Panel in your set of tools truly puts all the power of 6 Quantum indicators right at your fingertips. Get yours now.