

Description
Overview
If you are a more experienced trader, you might have come across the word “renko” or have seen it in trading forums and communities. It refers to a Japanese charting technique that is extremely popular among traders because of the particular way it plots price action. And it does this by removing time, and in effect focuses on price action delivering smooth trends and clear congestion phases. More importantly however it reveals momentum since it is independent of time and so as the market speeds up, so does the chart, and vice versa. This is a concept you would not see in a normal time-based chart.
Each bar is created when the price exceeds the previous bar’s high or low by a predefined amount or what we call the box size or brick size. This gives the renko chart a pleasant appearance of equally sized bars running up or down in 45-degree angles. This delivers some great advantages.
First, it allows traders to focus solely on price as the chart filters out all minor price fluctuations and market “noise”. This makes it easier for traders not only to identify strong moves but also to spot significant turning points, and so deploy smarter entries and exits.
Second, a renko chart helps traders in what is probably one of the most difficult aspects of trading, namely staying in a position once a move is underway. The renko chart does this by displaying price momentum as it speeds up and slows down and it does this because a renko chart is devoid of time.
Finally, because the bricks are drawn at 45-degree angles from each other, the charts are easier to read and to analyze.
Unfortunately, on TradingView the renko chart is extremely limited for free users and the Quantum Renko indicator offers a great solution with some exciting new features.
Dual Mode
You can use the Quantum Renko indicator for TradingView in 2 different ways.
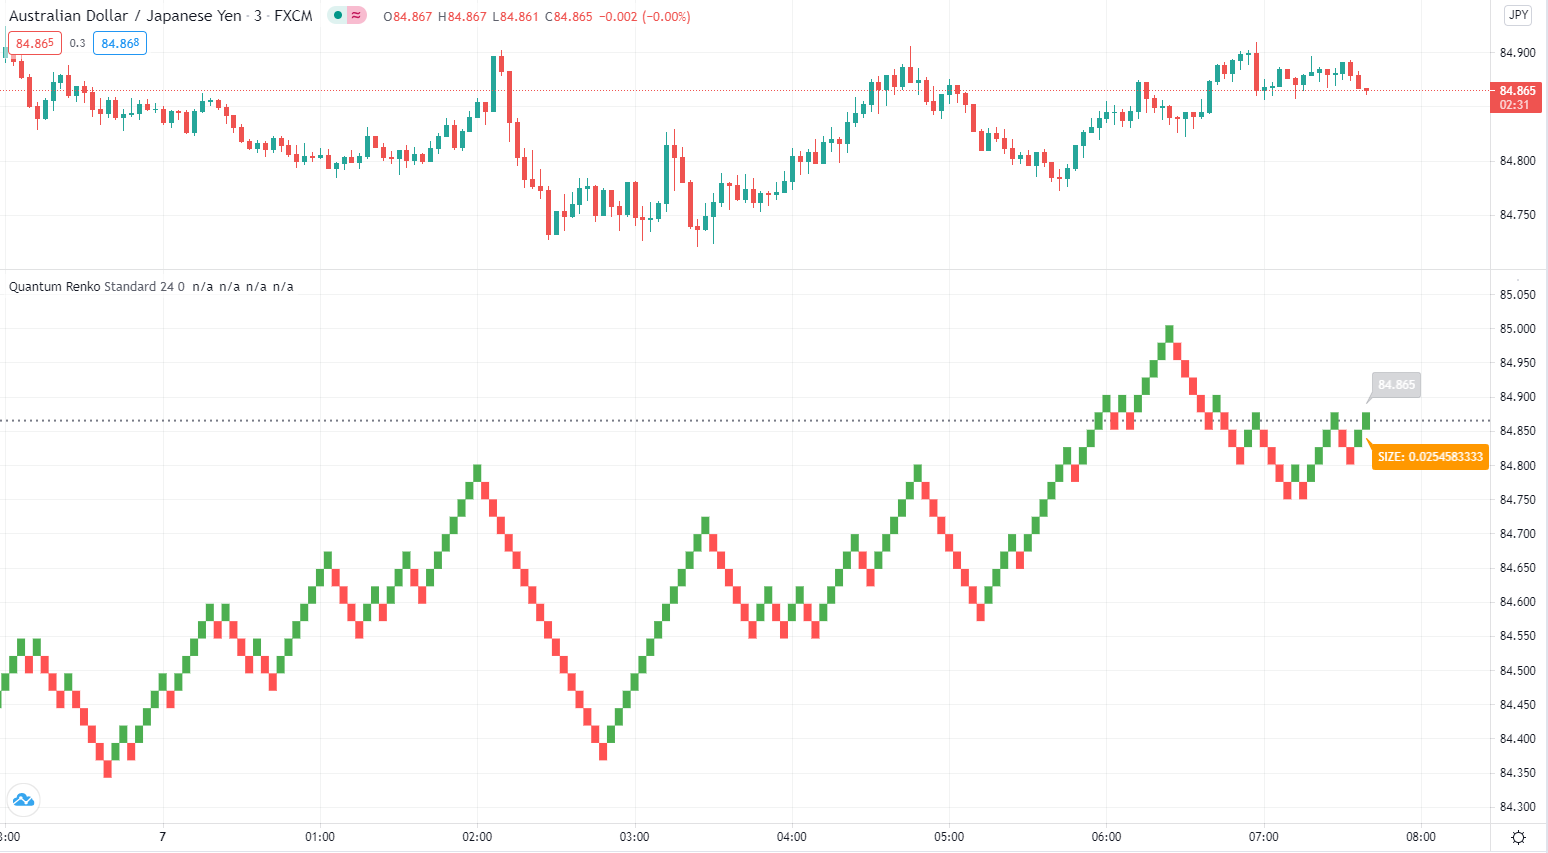
Standard
When applied, the Quantum Renko indicator appears below the main chart and creates a renko chart representation of the time-based chart above. Please note that in Standard mode, and since renko charts are devoid of time, the time x-axis of the chart does not apply to the renko chart displayed. Right off the bat, the Dynamic Renko indicator takes the time-based chart above and calculates the best box size that matches the current timeframe then uses it to create the renko bars below. The computed box size is displayed at the right-hand side of the renko chart’s last bar. It can also accept a fixed box size by entering it in the indicator’s Fixed Box Size input.
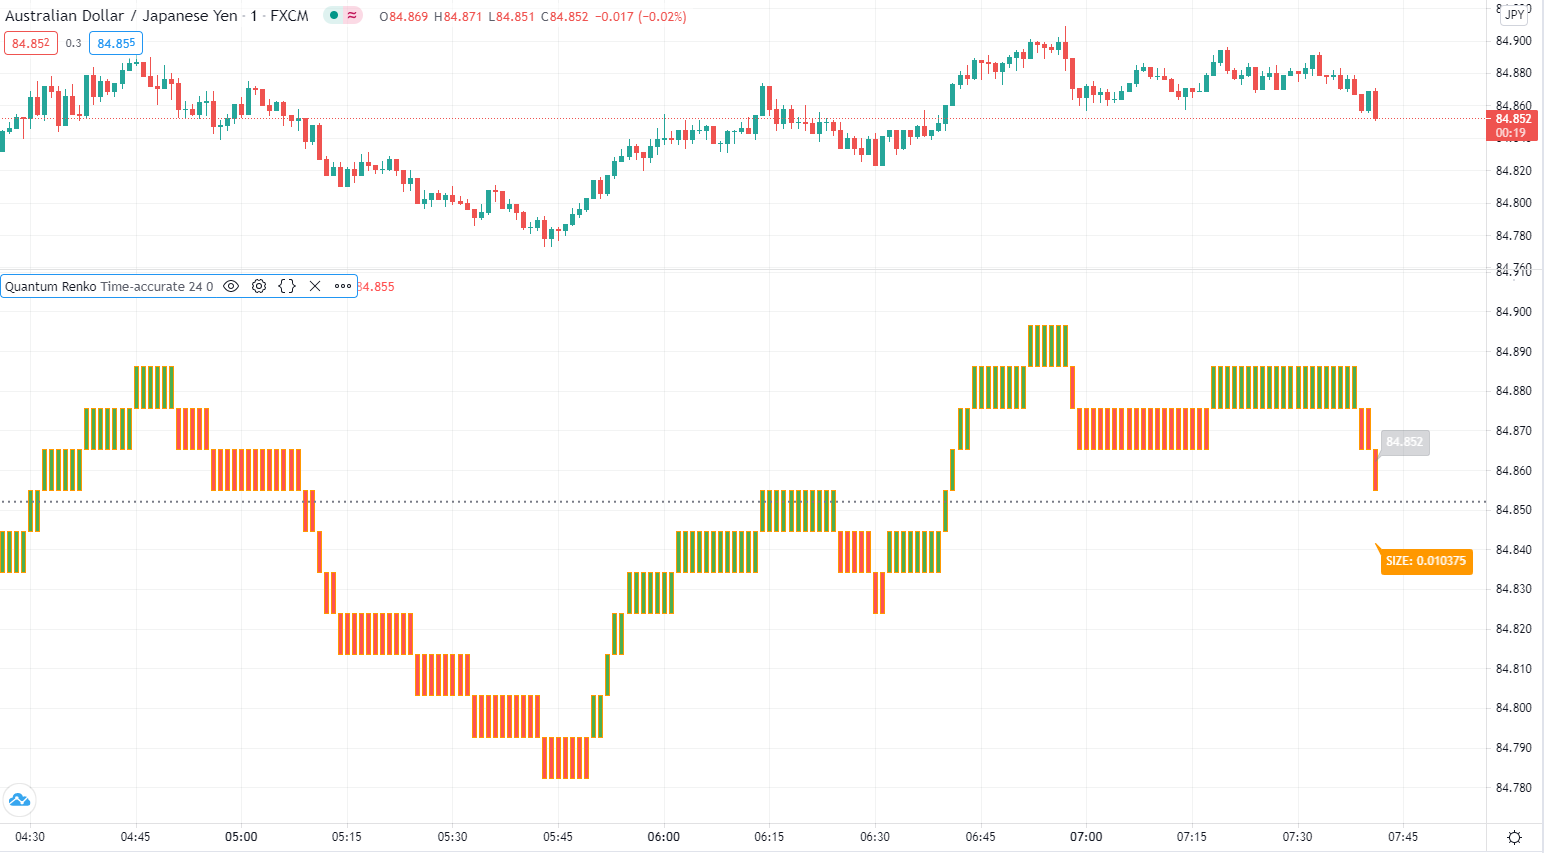
Time-accurate
The renko chart is a powerful approach to adopt as an intra-day trader, as it smooths out the price action into a series of blocks or steps, and so delivers a uniform chart which is easy to analyse. And of course, being a non time-based chart, it reveals momentum as the price action speeds up and slows down which is invaluable when scalping. However, there is a problem. As it is a non time-based chart it can be tricky to align this with a time based chart as the two are not synchronised. So, where a trader is running the renko alongside a time-based chart using one to analyse the other and vice versa, it is almost impossible to align the two correctly. This is even more significant when using indicators on the time-based chart such as volume, third party proprietary indicators or those which are freely available. So, what’s the answer?
The Time-accurate renko indicator solves the issue instantly. It is unique and as far as we know nobody has developed such an indicator to provide a solution to this problem. So how does it work? And as you might expect the answer is all in the name. We call it the Time-accurate renko indicator because that’s what it is. In simple terms it aligns the bricks it builds with the time-based chart above. So where for example the time-based price action moves into congestion, so does the time accurate renko and will build a horizontal wall of bricks at that level until the price action breaks away, at which point the Time-accurate renko begins building in the normal way with bricks which rise or fall with the trend. What the chart then delivers is a wonderful picture of clear levels of support and resistance as you might see when a brick wall is under construction, helping traders to establish breakaway price action which all the time is mirrored on the time-based chart with the chosen indicators. What makes the Time-accurate renko even more powerful is the option to select either your own choice of brick size or alternatively the optimised version which means you are trading in harmony with the market. The optimal setting is derived from calculations based on average true range and delivers the perfect brick size for all markets, timeframes and session times, so there is no more guesswork. The indicator does it all for you. However, if you prefer to set your own brick size this is available also.
And the best news of all, is that the Time-accurate renko is included with the Standard renko, so you have two indicators for the price of one and can switch from one to the other at any time or perhaps run both. The choice is yours with this unique combination of renko indicators.