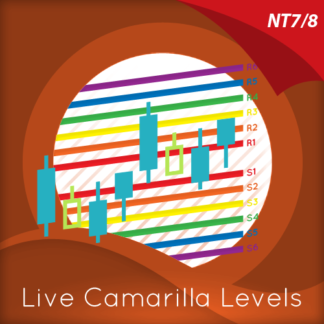


Description
If trading success is about anything, it’s about judging risk. Assessing risk correctly, leads to consistency. Consistency leads to profitable trades. Profitable trades lead to a healthy and growing trading account.
In trading there are only two risks to consider:
- The financial risk
- The risk on the trade
The first is easy and dealt with as part of your risk and money management. The second is much more difficult to assess. This portfolio of indicators, has been designed with one objective in mind. To address the second of these. In other words, to help you assess, quantify and manage the risk on the trade, from start to finish.
Let’s break it down into a simple three step process:
Step 1 – Getting in
As a day trader, you already know the importance of trading with the momentum of the market. But how do you see this visually, and more importantly how do you know what it is. This is why many day traders ultimately move to tick charts as the chart of choice. Why? Because with a tick chart, and indeed with a renko chart also, time has been removed from the equation, and as a result, you are able to visually ‘see’ market momentum as delivery of the candles and bars speeds up and slows down through the trading session. These are the periods when the market is active and moving with strong momentum. It is the time to join in, and build positions. But the problem for many day traders is knowing what speed to set the tick chart too, as this varies from instrument to instrument and market to market, and more importantly varies throughout the trading session. This is where the Quantum TickSpeedometer steps in. It is your starting point for getting in, delivering dynamic tick activity in real time, and signalling the correct settings for your charts, allowing you to select the correct tick speed for your time based chart, and trading with the market momentum accordingly. The indicator works in all markets, so whether you are an index trader trading the emini futures, a commodities trader for gold, silver or oil, or trading stocks intraday, this is the perfect instrument take your trading to the next level.
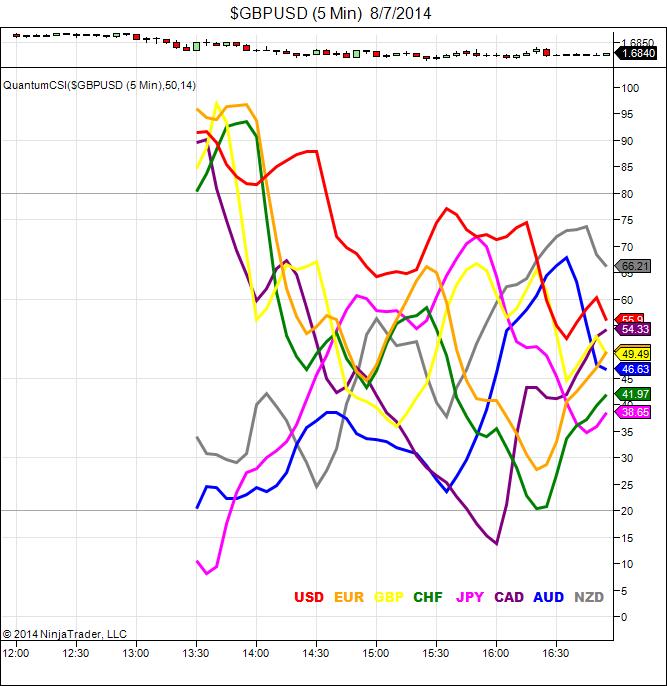
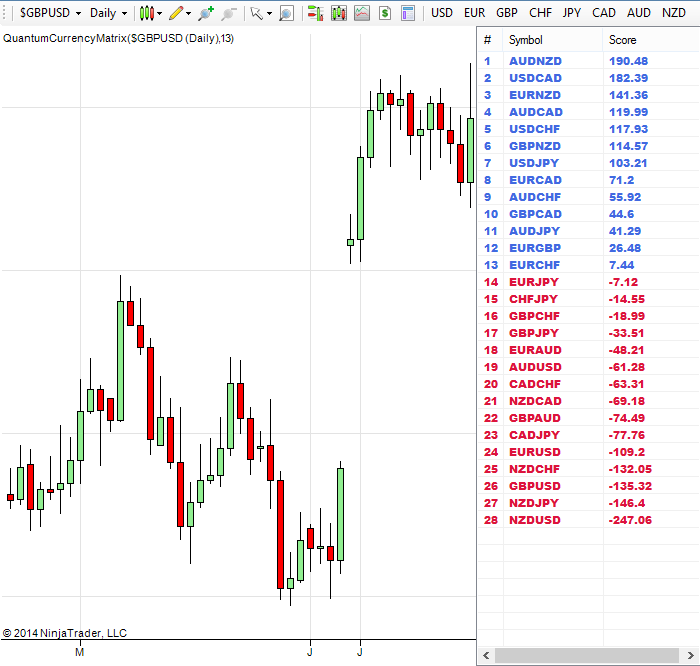
If you are trading forex, whether spot of futures, the Quantum Currency Strength indicator is always the place to start. Here it’s all about which currencies are strong, which are weak, and which are about to reverse. The extremes on your indicator will tell you this instantly, and across all timeframes. The currency matrix then complements your analysis by revealing whether this strength of weakness is universal across all the related currency pairs.
Indeed, speaking of multiple charts, this is a great way to apply all the indicators using two or three timeframes. This reduces the risk still further.
Step 2 – Staying in
This is the hardest part for most traders. The market never moves higher or lower in a straightforward way. Pullbacks and reversals are part and parcel of every move. But this is where emotional trading decisions can be destructive, both to your confidence and to your account. This is where success lies. If you can ignore these emotions, and continue to hold a position through these phases of price action, then success awaits. This is where the Quantum Trading indicators will come to your aid. They will give you that confidence, that inner belief, and calm the emotional response. Why? Because they are helping you interpret the price action, and delivering clear and simple messages, in different but unified ways.
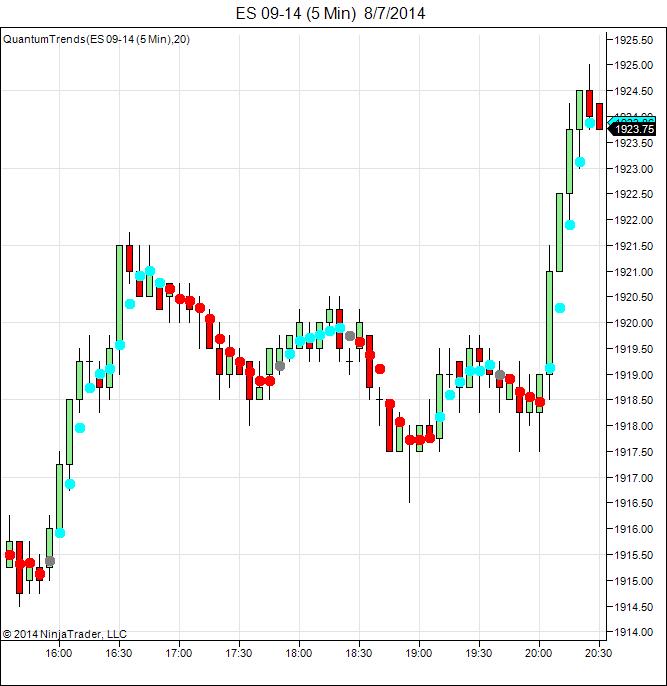
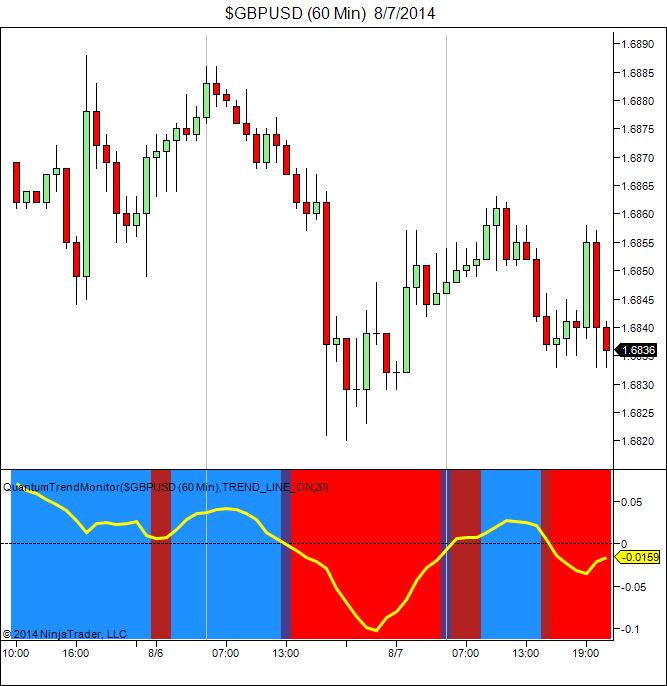
First, the Quantum Trends defines where the price action is in its current journey. Is it a bullish trend, a bearish trend, or so the market in congestion. Next, the Quantum Trend Monitor steps in, smoothing the price action, and giving you the ‘balanced view’ of the longer term trend. These two indicators are like the celestial twins of Gemini – perfectly balanced and working in tandem.
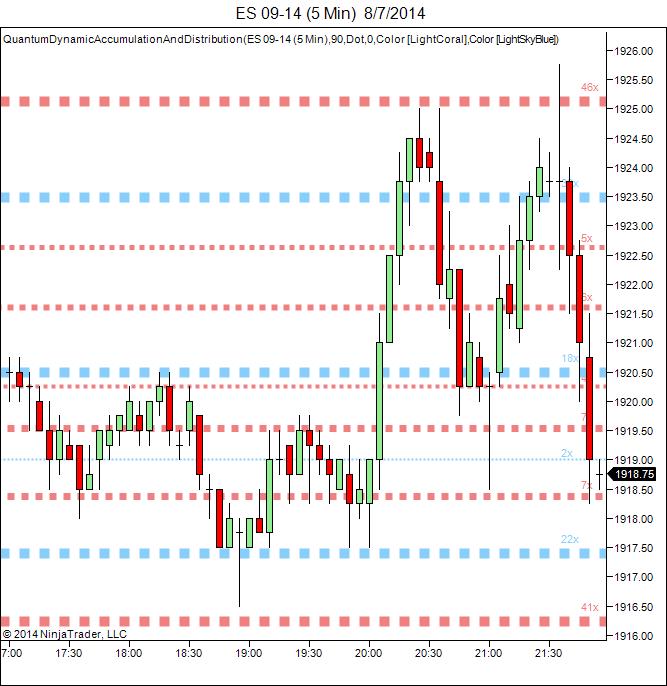
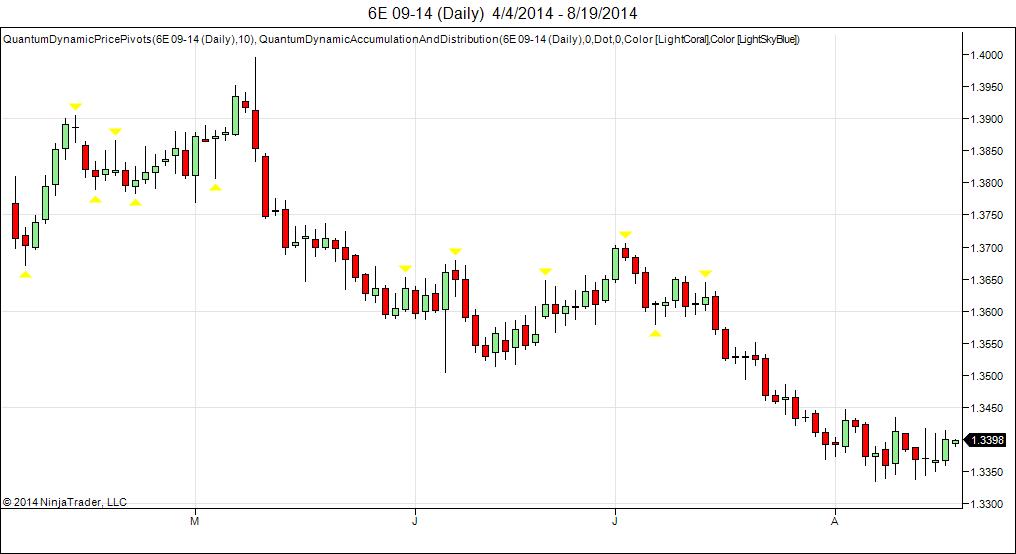
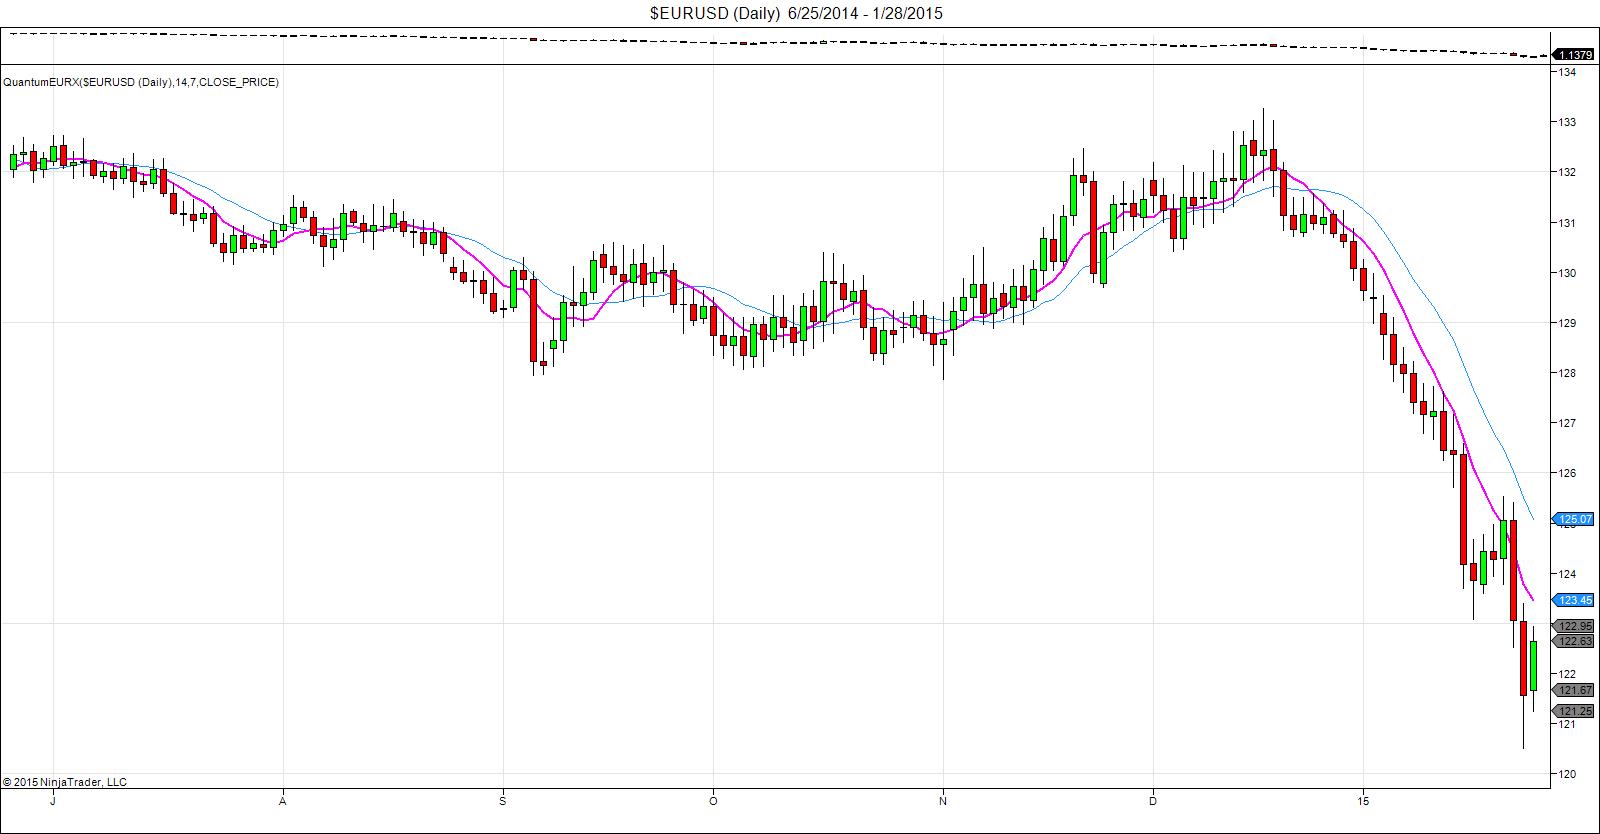
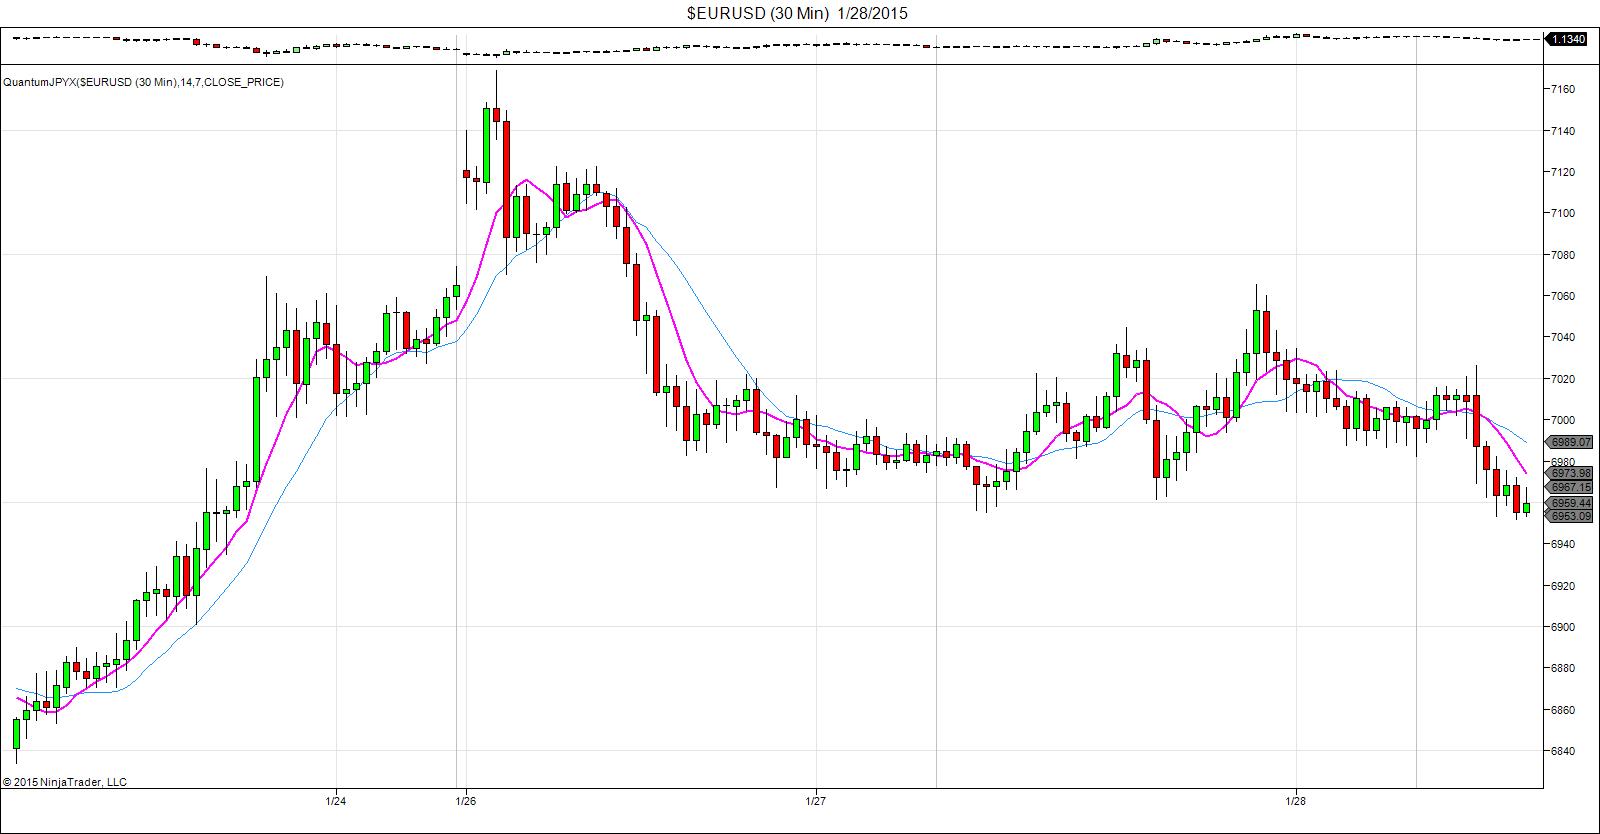
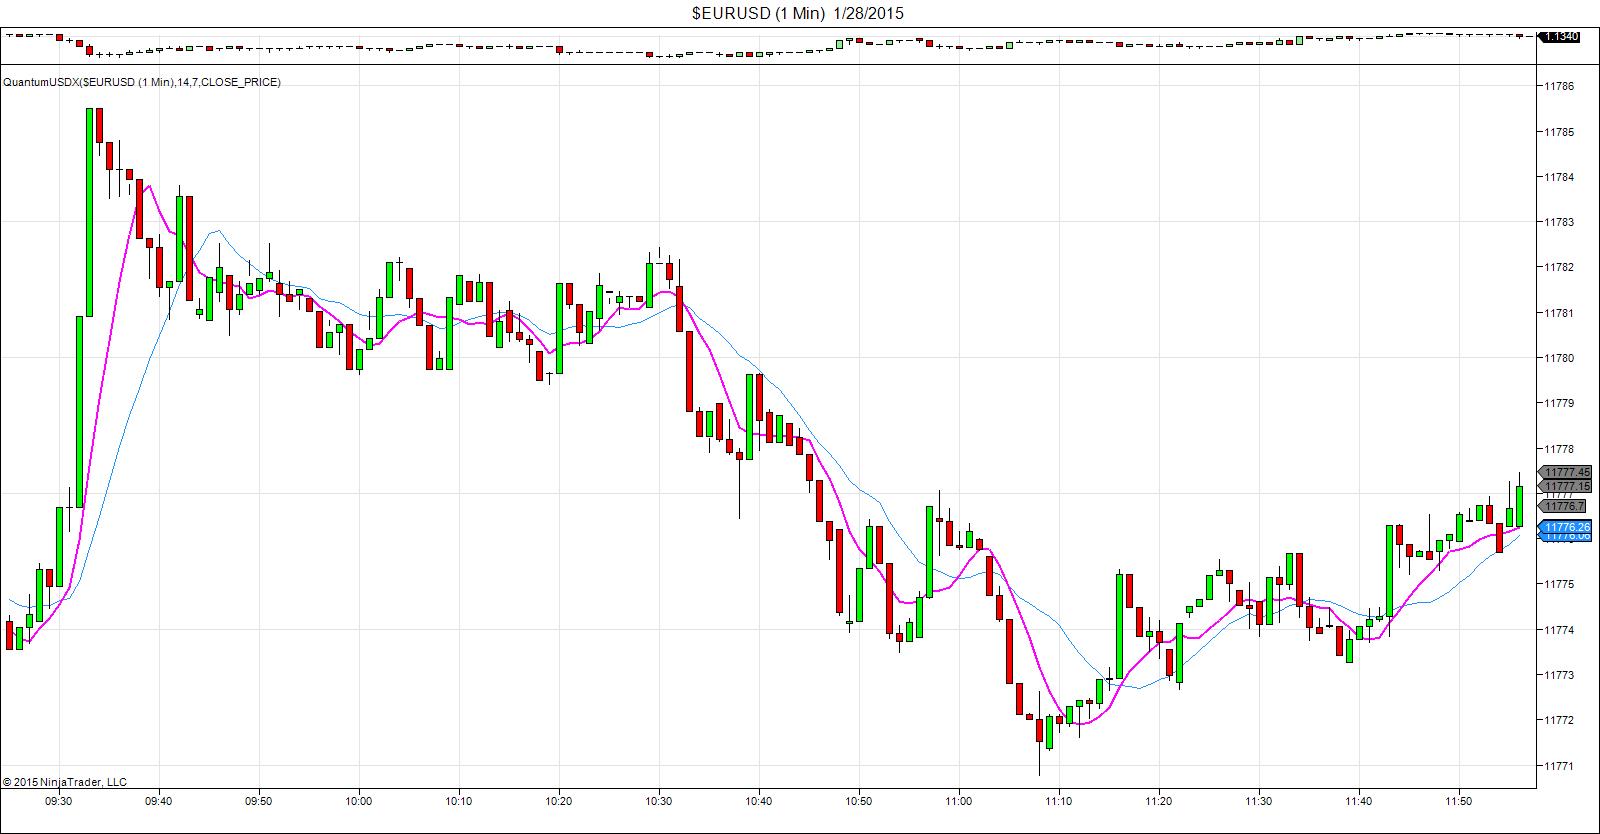
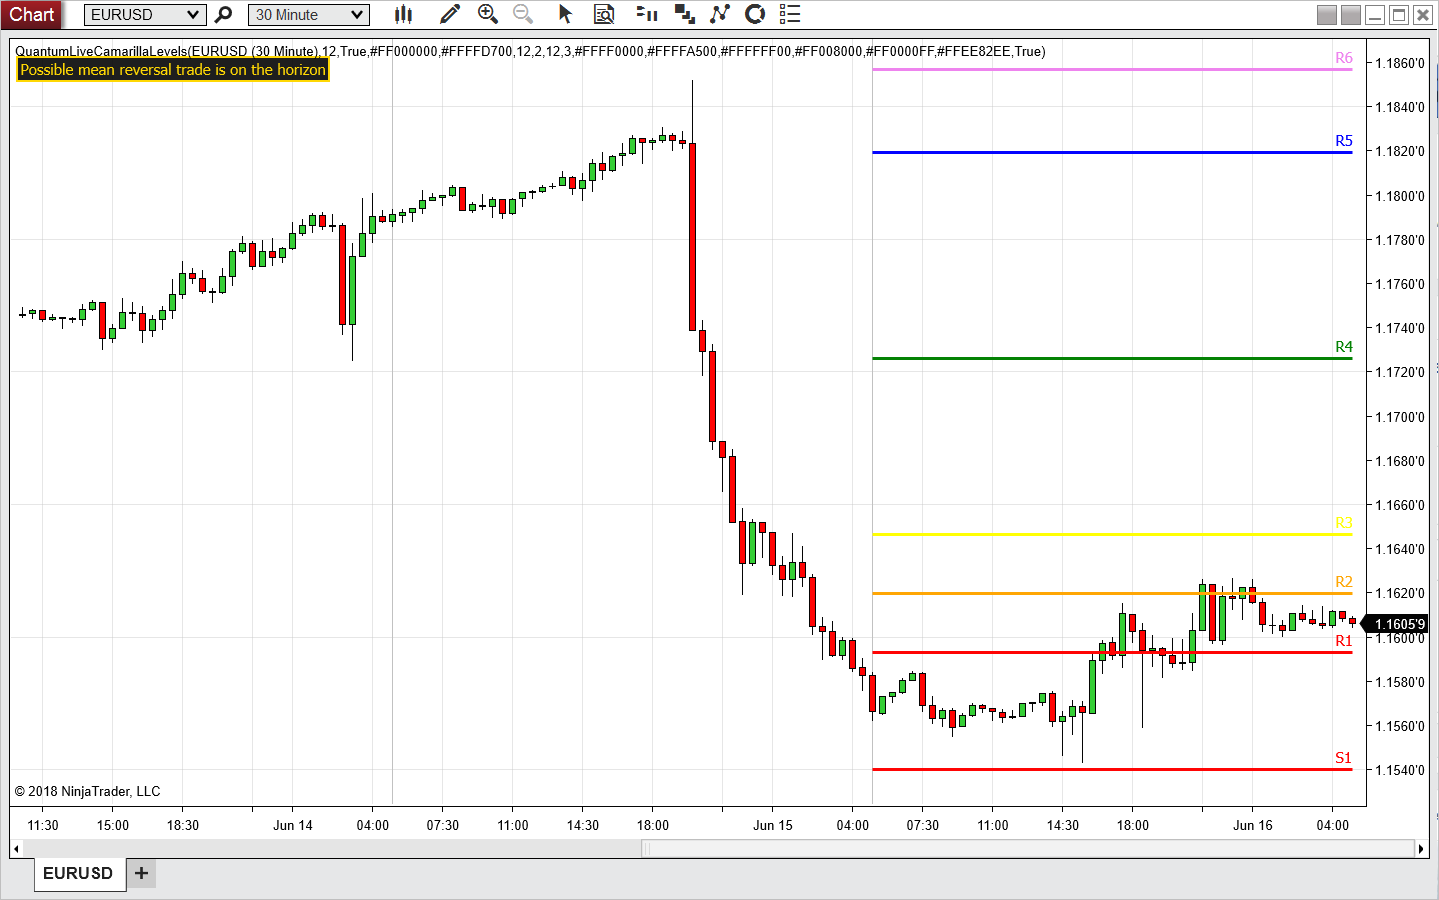
The Quantum Pivots indicator and the Quantum Volatility indicator then describe the price action in detail, keeping you safe, yet adding further description signals along the way. The Quantum Accumulation and Distribution indicator then comes into play, giving you dynamic price levels for possible exits or profit taking, and clearly defining potential areas of support and resistance ahead. Last of course for forex traders come the indices, along with the currency strength indicator and the currency matrix, all underpinning your chart, and giving clear signals as to the direction of all the major currencies. For the indices, it’s the US dollar, the Yen and the euro. The choice of index is personal, but you have the Quantum USDX, Quantum EURX all supported with the third of our indices, the Quantum JPYX.
Step 3 – Getting out
Finally it’s time to close your position, but which indicators help here? Well the simple answers is all of them! Let’s take them one by one.
First – let’s start with the Quantum Currency Strength indicator. If it was good enough to get you in, then it’s good enough to get you out as well. If the currency pair you are trading has moved from one extreme to another, or perhaps even bunching in the middle of the chart, then this may be the time to close. Next, check your Quantum Trends, and your Quantum Trend Monitor. If the latter is in transition, or has changed from one colour to another, then it is almost certainly time to close. This may also be confirmed with your Quantum Accumulation and Distribution indicator, particularly if the price action is running into an area of potential support or resistance. The Quantum TickSpeedometer will also be playing its part here, signalling whether market momentum is continuing to remain strong, or is perhaps draining away with a lack of interest in the market. Think of this indicator as your ‘visual’ on the trading pit. If it’s noisy and active, then the market is moving, if it’s quiet and inactive, then the market has no momentum and not a time to be trading!
Whatever the indicator, each will reveal in their own way the right time to get out, take your profits, and wait for the next trading opportunity to come along. It’s a simple three step process, and with the full Quantum Trading toolkit – even more so, as you are trading using the next generation of trading indicators, designed for one person – YOU.
Invest in your future success. Invest in the Quantum Trading full package – NOW.