
Description
If you are serious about day trading, but do not plan to trade the forex market, then this is the perfect package for you. The Quantum Trading essentials package delivers all the indicators you need for trading indices, commodities, stocks and bonds, combined with the power of the NinjaTrader platform.
Each indicator has been developed with one simple objective in mind – to help you assess risk both before opening a new position, and then to manage it once your money is in the market.
After all in trading, there are only two risks to consider:
- The financial risk
- The risk on the trade
The first is easy and dealt with as part of your risk and money management. The second is much more difficult to assess. This portfolio of indicators, has been designed with one objective in mind. To address the second of these. In other words, to help you assess, quantify, and manage the risk on the trade from start to finish.
Getting in with tick and time charts
Quantum Trading brings you one of the essential indicators for day trading for your trading arsenal – a must have indicator for professional traders. The Quantum TickSpeedometer introduces you to trading using tick charts, opening a whole new world of trading opportunities and possibilities. You can think of a tick chart as a ‘visual’ way of seeing the trading pit, where momentum is revealed on the chart, something you never see on a time based chart. This is the power of a tick chart, as the effect of time has been removed revealing market momentum, and just like the trading pit, when the market is noisy and tick candles are forming quickly, then you can be assured the market has momentum and it’s time to trade. Equally, if the tick activity is low, then the market is quiet and lacking momentum. It’s time to sit on the sidelines along with the professional money! And herein lies the key. Market momentum is constantly changing throughout the session, and even more importantly, each market has its own character which is very different to another. The tick profile for the ES emini is very different to that for the YM emini or gold. This is why trading tick charts may seem tricky as most traders have NO idea which is the most appropriate number of ticks to create charts with.
This is where the Quantum Tick Speedometer steps in, effectively converting time charts to tick charts, solving the relentless problem of choosing the RIGHT tick chart to trade on. Even more important, the indicator shows you visually using a simple traffic light system when the market is active in green, running in normal on orange, and lacking momentum and direction in red. Throughout the trading session the indicator delivers the change in tick speeds allowing you to adjust your charts accordingly and trading in synch with the market momentum. Trading using both tick and time based charts is an excellent way to create your workspace, with the tick charts getting you in, and complemented by your time based charts to provide longer term perspective.
Staying in
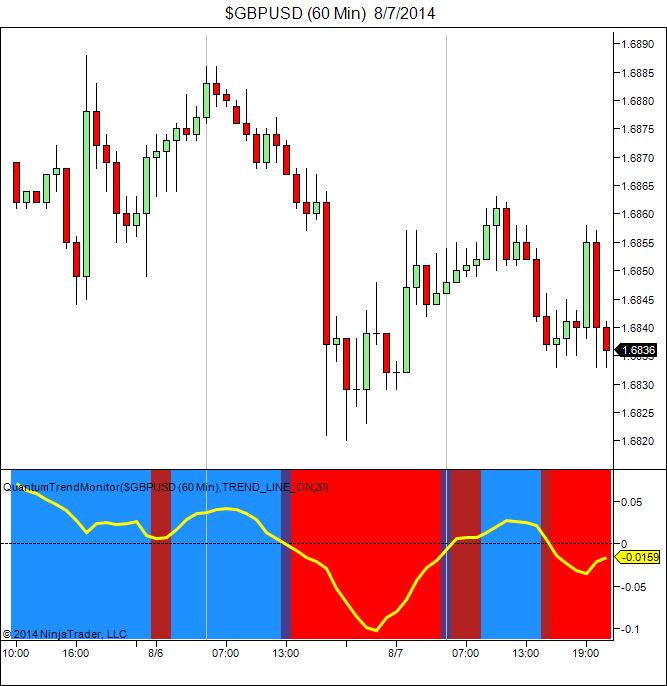
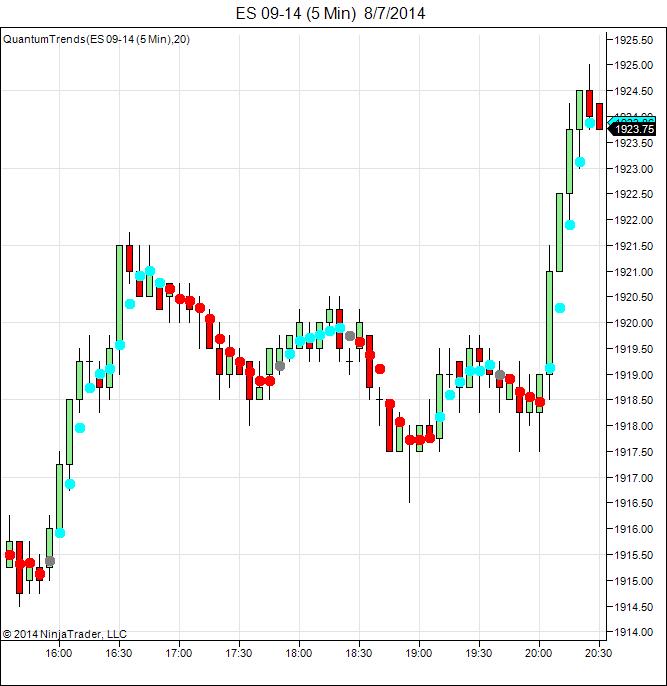
Staying in is the hardest part for most traders. The market never moves higher or lower in a straightforward way. Pullbacks and reversals are part and parcel of every move. But this is where emotional trading decisions can be destructive, both to your confidence and to your account. This is where success lies. If you can ignore these emotions, and continue to hold a position through these phases with confidence, that inner belief will then calm the emotional response. Why? Because they are helping you interpret the price action by delivering clear and simple signals, allowing you to make clear and logical decisions free from emotion, and maximising your profits as a result. This is where the other indicators step in, with the Quantum Trends and Quantum Trend Monitor working in tandem to show you visually and quickly when a new trend is starting, pausing or ending.
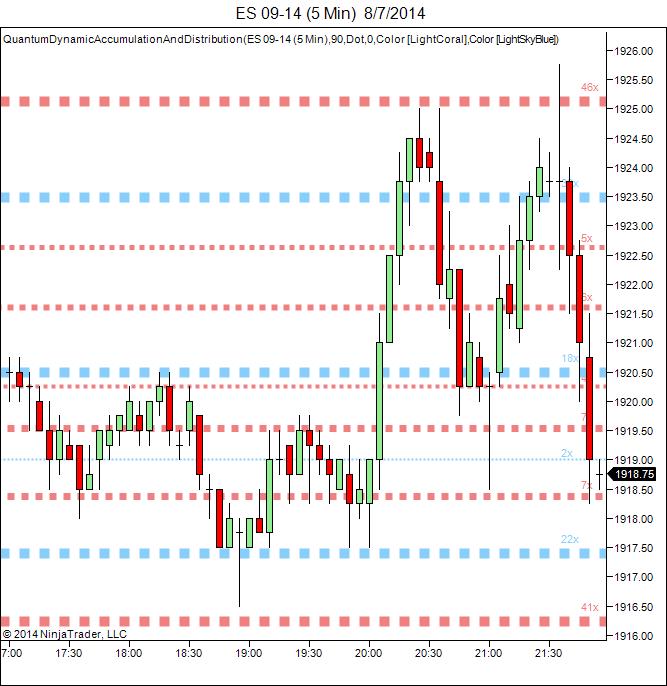
Price action too comes under the spotlight, with the Quantum Accumulation and Distribution indicator showing you dynamically and precisely those regions on the chart where strong buying or selling has been present in the past, and therefore likely to present resistance or support to the current price action. The indicator describes these graphically in blue and red, to show those regions where buying has been dominant and supportive of a move lower from above, and red where selling has been in the ascendancy and therefore likely to act as resistance when approached from below. Numerical values are also ascribed to each level, giving you the complete picture and helping you to stay in as market trends develop.
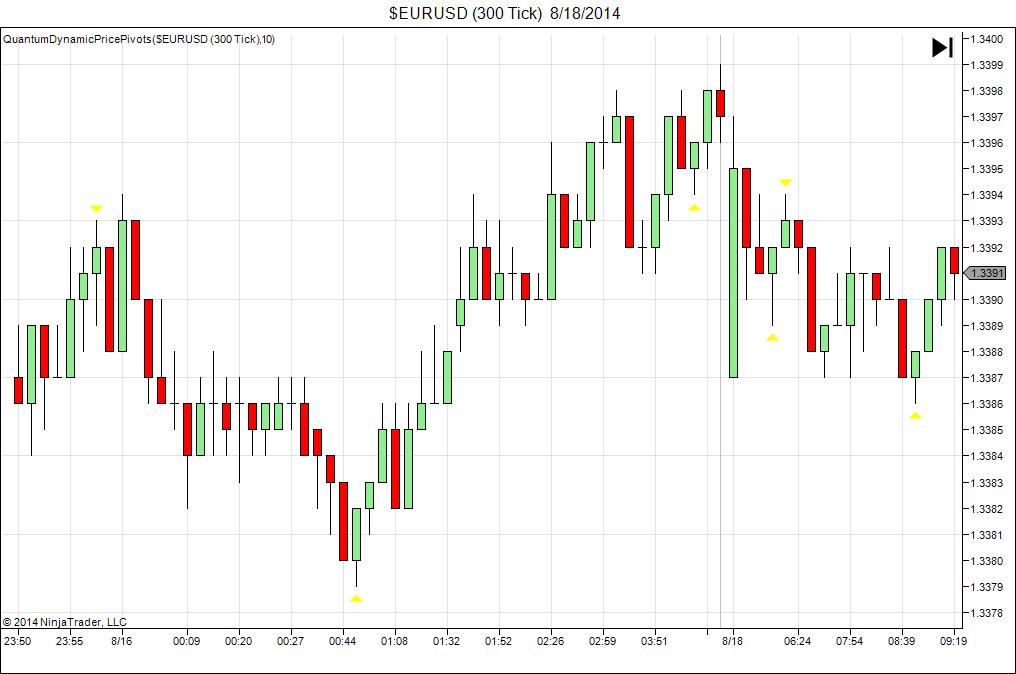
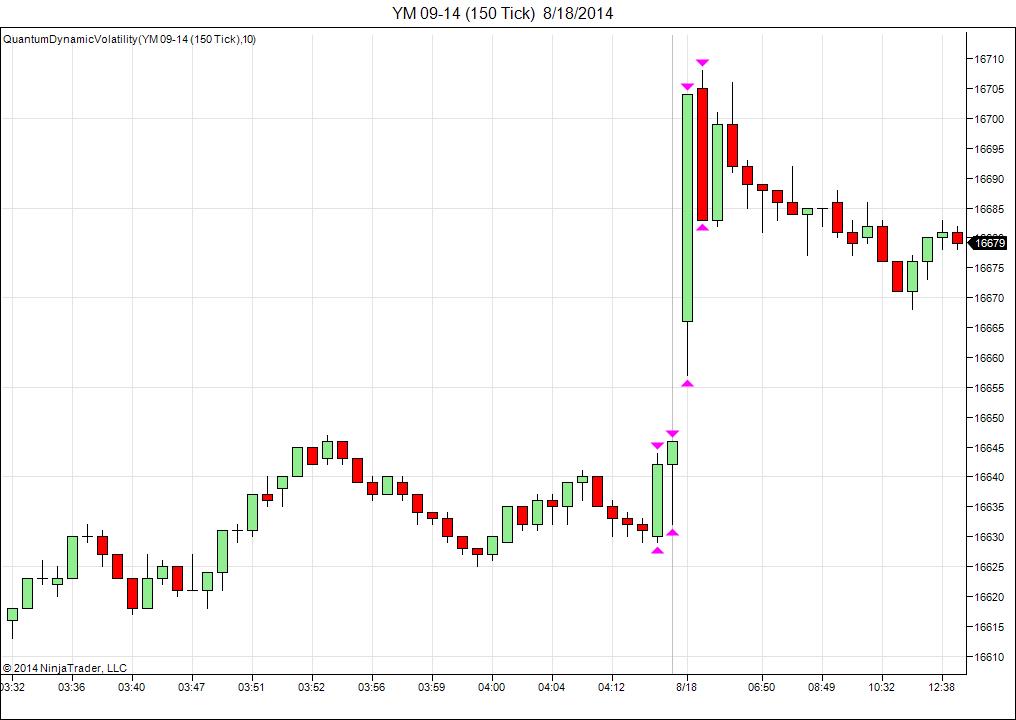
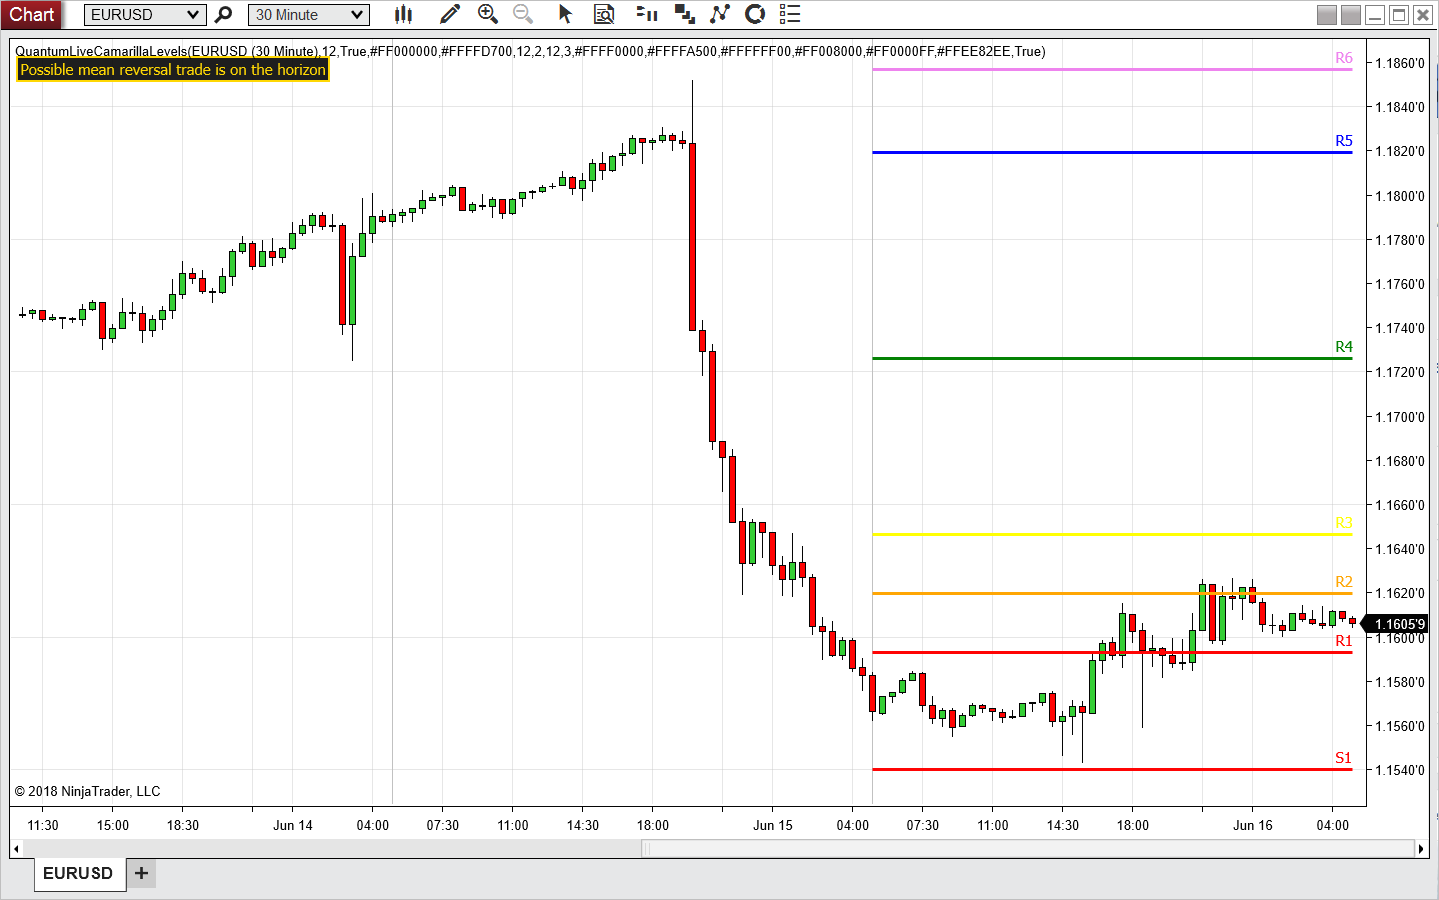
Finally, the price action is complemented with the Pivots indicator and the Volatility indicator, simple yet powerful tools which signal short term price reversals, and price action which is outside the Average True Range, and indicative of market volatility.
Getting out
Once again, the Quantum indicators act in concert to help you assess risk and decide whether it’s time to close out any existing positions. First, the TickSpeedometer may be signalling market momentum draining away with tick activity falling, and the indicator moving to red in multiple timeframes. At the same time, perhaps the Trends indicator combined with the Trend Monitor is in transition, perhaps changing color for a bright red or blue to a darker color, signalling a potential pause or possible reversal in due course. Finally the Accumulation and Distribution indicator may be showing a deep area of potential resistance or support in close proximity. All signals to heed, and consider and exit and time to take any profit off the table. After all, the costs of trading are low, and even if the market continues in the same direction, getting back in is easy with the Quantum essentials package – so whether you are a scalping trader, swing or trend trader, or even a longer term investor, why not invest in the essentials package today, and take your trading to the next level.