Why Volume and Volume Price Analysis Are Essential for Traders – and How Quantum Indicators Support This Methodology
 Volume is the lifeblood of markets. It represents real money flowing in or out—actual participation from professionals and institutions. Price alone can mislead. A sharp move on low volume often signals weakness or a trap. High volume confirms conviction. This is the foundation of Volume Price Analysis (VPA)—a methodology that combines price action with volume to reveal true market intent. VPA strips away noise. It shows where smart money accumulates or distributes. Traders using VPA make decisions based on facts, not guesswork.
Why Does Volume Matter?
Why does volume matter so much? Markets move on supply and demand. Professionals trade large sizes—this creates volume. High-volume rallies indicate strong buying pressure. Low volume at extremes warns of exhaustion—potential reversals. VPA gives traders an edge by aligning with institutional flows. Ignore volume, and you’re trading blind. Embrace it, and you see the market’s real story. In volatile environments like forex, futures, or stocks, VPA reduces emotional decisions and improves consistency.
How DO Quantum Indicators Support VPA?
How do Quantum indicators support VPA? We designed our tools—such as Trend Monitor, VPOC, Accumulation/Distribution, and TickSpeedometer—to clearly visualise volume intent. The Trend Monitor aligns direction with volume conviction. VPOC marks fair value levels where volume clusters. Accumulation/Distribution spots build phases early. These indicators turn raw volume data into actionable signals. On platforms like MT4, MT5, or NinjaTrader, integration is seamless. Traders see high-probability setups faster—high volume confirmation validates entries.
Who Is VPA And Quantum Indicators For?
Who is VPA and Quantum indicators for? Serious traders seeking discipline—day traders, swing traders, or position traders in forex, indices, commodities, or stocks. Beginners benefit from clear visuals. Experienced traders gain precision. It’s not for gamblers chasing tips or those unwilling to study volume. VPA rewards patience and practice. If you want quick riches without effort, look elsewhere.
Creative Ways To Use Quantum VPA Tools
Creative ways to use Quantum VPA tools abound. Combine Trend Monitor with VPOC for confluence—high volume at key levels signals strong holds. Use TickSpeedometer on tick charts for scalping surges. Multi-timeframe VPA: Higher frames for bias, lower for timing. In forex, pair Currency Strength with VPOC for relational edge. In stocks or futures, spot distribution early—short on low volume highs. Adapt across assets—volume truth is universal.
Quantum indicators make VPA accessible and powerful. Start with one tool. Master its signals. Build from there. Volume reveals what price hides. Trade with conviction—Quantum delivers the edge.
About Anna Coulling

With Anna Coulling as the creator and founder of volume price analysis, Quantum Trading, by extension, is the home of volume-based indicators.
Anna Coulling is a renowned trader, educator, and author with over two decades of experience in financial markets. She is the creator of Volume Price Analysis (VPA), a methodology that combines price action with volume to reveal professional intent. Through her books, online courses, and Quantum Trading indicators, Anna has empowered thousands of traders worldwide. Her practical, no-nonsense approach demystifies markets—focusing on what volume truly reveals. Anna’s work spans forex, stocks, futures, and commodities. She founded Quantum Trading to provide tools that make VPA accessible and effective.
 Her best-selling book, A Complete Guide to Volume Price Analysis, is widely regarded as the bible of volume trading. First published in 2012, it remains the definitive starting point for new volume traders.
The book explains VPA clearly—high volume confirms conviction, low volume warns of market traps. With real examples across markets, it teaches reading professional accumulation and distribution.
Beginners love its logical progression—no jargon, just actionable insights. Experienced traders return to it for refinement. It’s the essential foundation—master this, and volume becomes your edge.
Since its first publication, it has been available in both paperback and audiobook formats, read by Anna Coulling. You can find all the details on Anna by clicking the link here: A Complete Guide To Volume Price Analysis. It is now also available in paperback colour, as are many of her other books. Finally, it is also published in many other languages, including Chinese, Japanese, Russian, Spanish, French and many more.
Quantum Trading
At Quantum Trading, we are passionate about three things.
The first is trading. The second is in developing trading indicators that forecast the future. And the third? Exceptional customer service.
Our approach to development is simple. Far to many indicators tell you what has already happened. Useless to you as a trader. You need to know what is going to happen next and to position yourself accordingly. That’s why we call them the ‘next generation of trading indicators’. Because that’s what they are! Take a look and see for yourself. Each one has a specific role that builds on the next to provide a complete suite of trading tools.
Volume Tools And Indicators
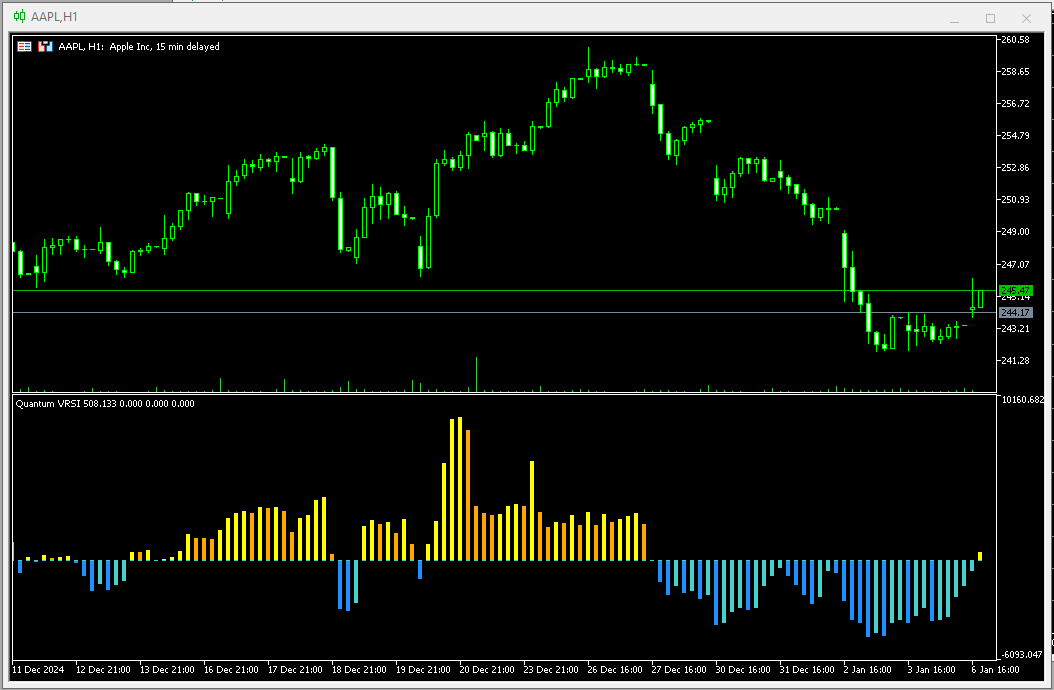 Built from the ground up and embracing every aspect of volume, we have indicators such as the volume relative strength indicator (VRSI), which accounts for volume’s relative nature on the chart. It presents this information graphically for you on the chart, and is what we define as energy. If you have rising energy in a trend, then it will continue.
If energy falls, momentum stalls. And as energy falls, so will the market and vice versa.
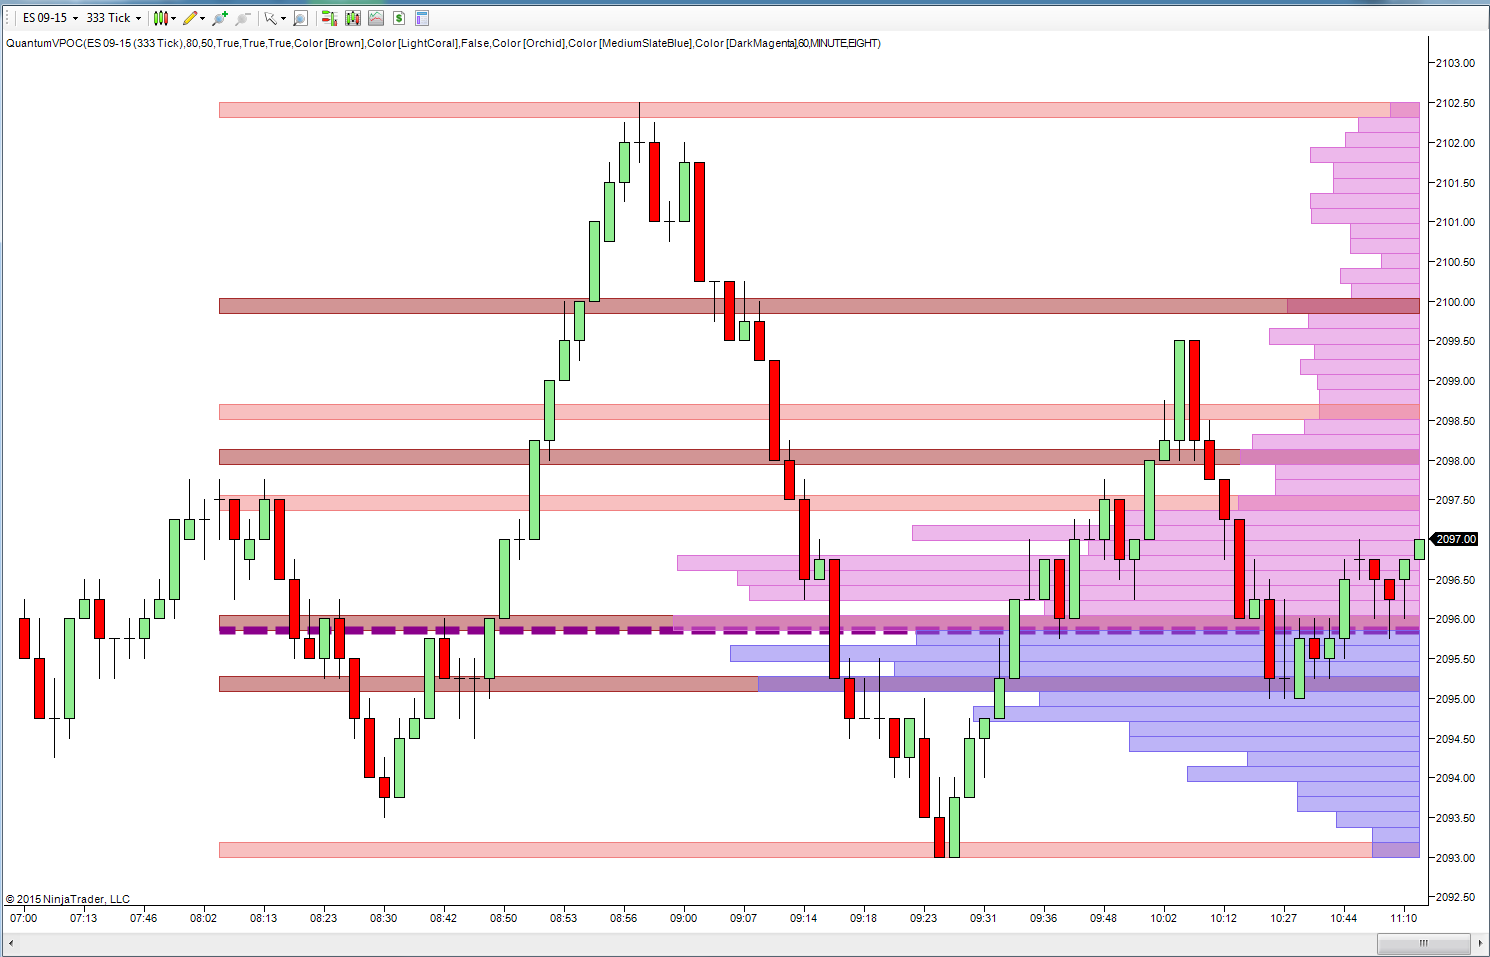 The volume point of control is another volume-based indicator which is available across all our platforms. This indicator uses the Y-axis volume in the chart and displays it as high-volume and low-volume nodes. The VPOC itself defines the fair value region. This is where the greatest concentration of volume is built. Prices move swiftly through low-volume nodes since there is no resistance or support. Equally, at high-volume nodes, the opposite is true.
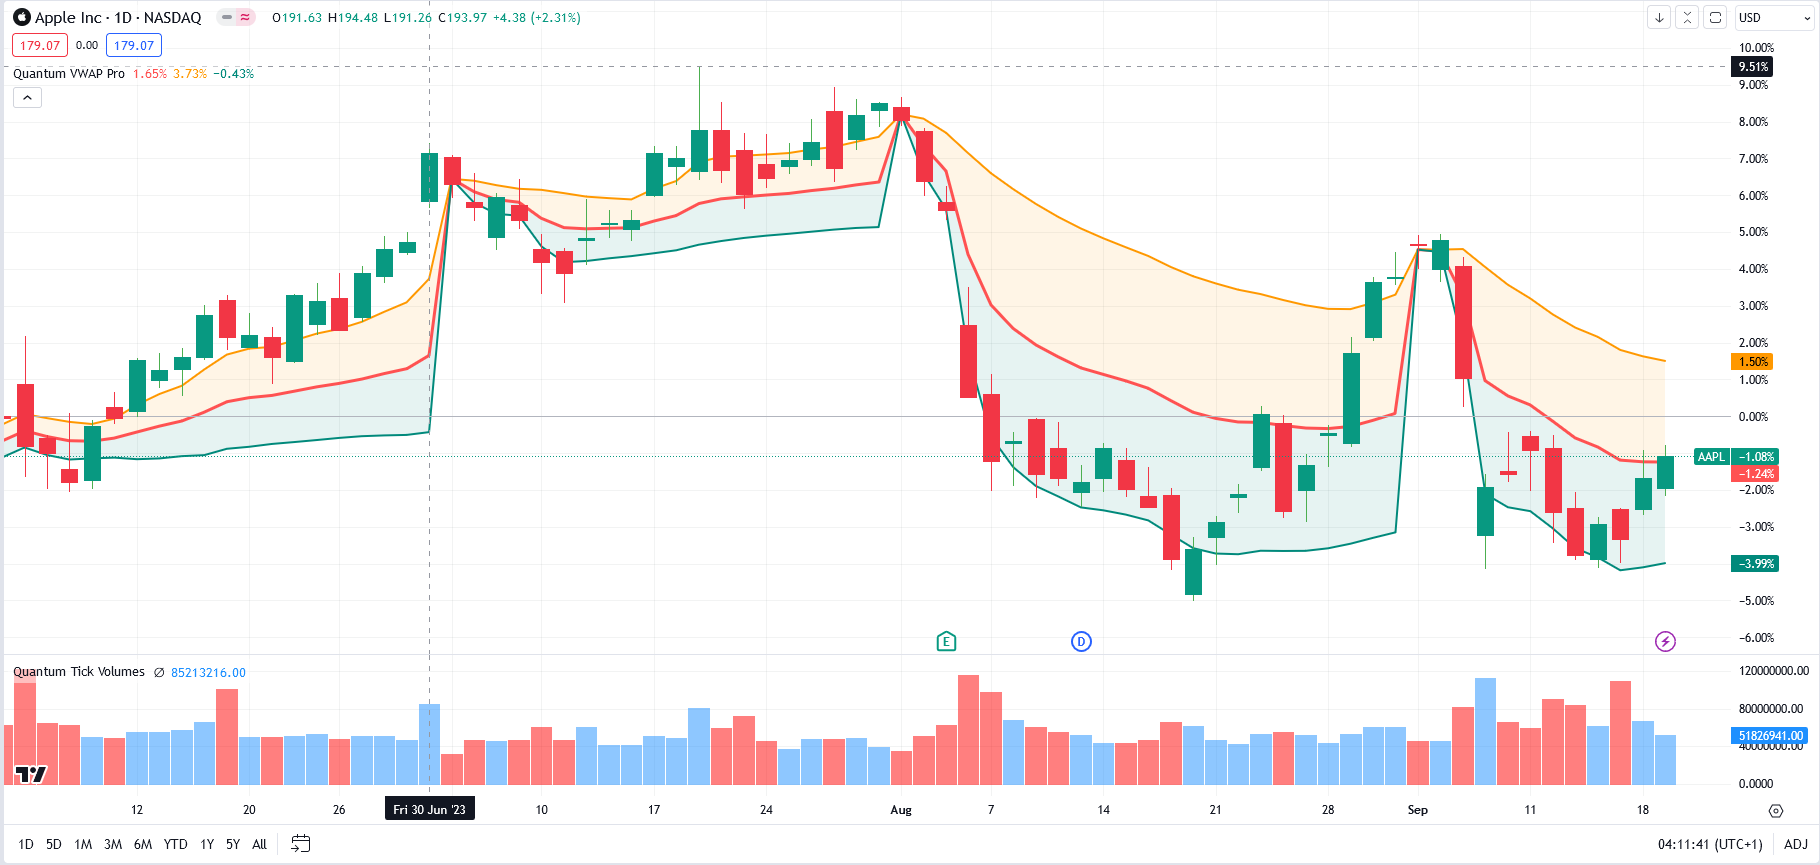 Speaking of value areas, another indicator in the volume toolkit is the VWAP pro, or volume weighted average price. But this is not simply one indicator. It is, in fact, five. Add the VWAP, AVWAP, MVWAP, TWAP, and Interday VWAP. Five volume-weighted tools in one.
For market strength, we have the market strength indicator, which can be used across every market, whether for stocks, commodities, ETFs, futures or forex. It displays strengths and weaknesses visually, giving you a clear picture of both relational data and overbought and oversold extremes.
Specific Tools and Indicators
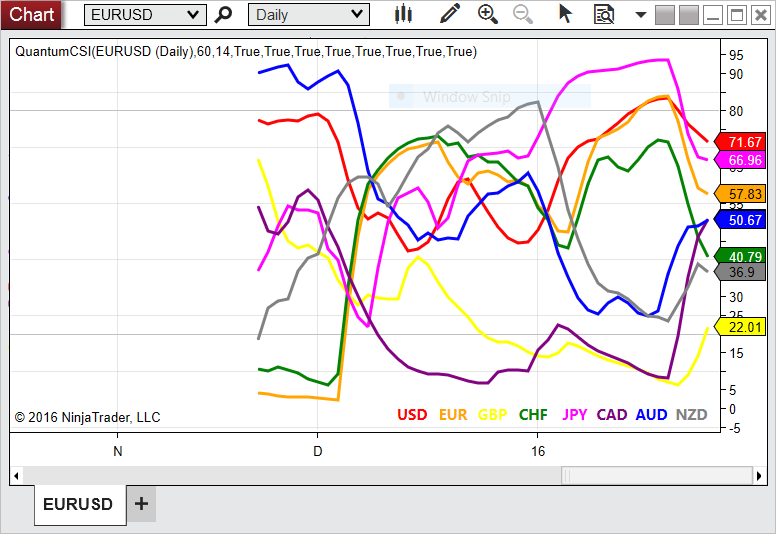 From there, we move to over tools and indicators for specific jobs, such as the Quantum Currency Strength Indicator. This reveals the single most important piece of information to you as a forex trader. Whether a currency is strong or weak. As it approaches these regions, you are then ideally placed to take advantage. The indicator is forecasting the next price move, ahead of everyone else! Powerful and simple. But if you prefer trading cryptocurrencies, why not make life easier and invest in the cryptocurrency strength indicator for TradingView? It works across all timeframes, and you can choose from all the cryptocurrencies available on the platform.
The Quantum Trends does a similar job. It tells you instantly when the trend is changing in real time, from bullish to bearish or vice versa. Or even more important, into consolidation.
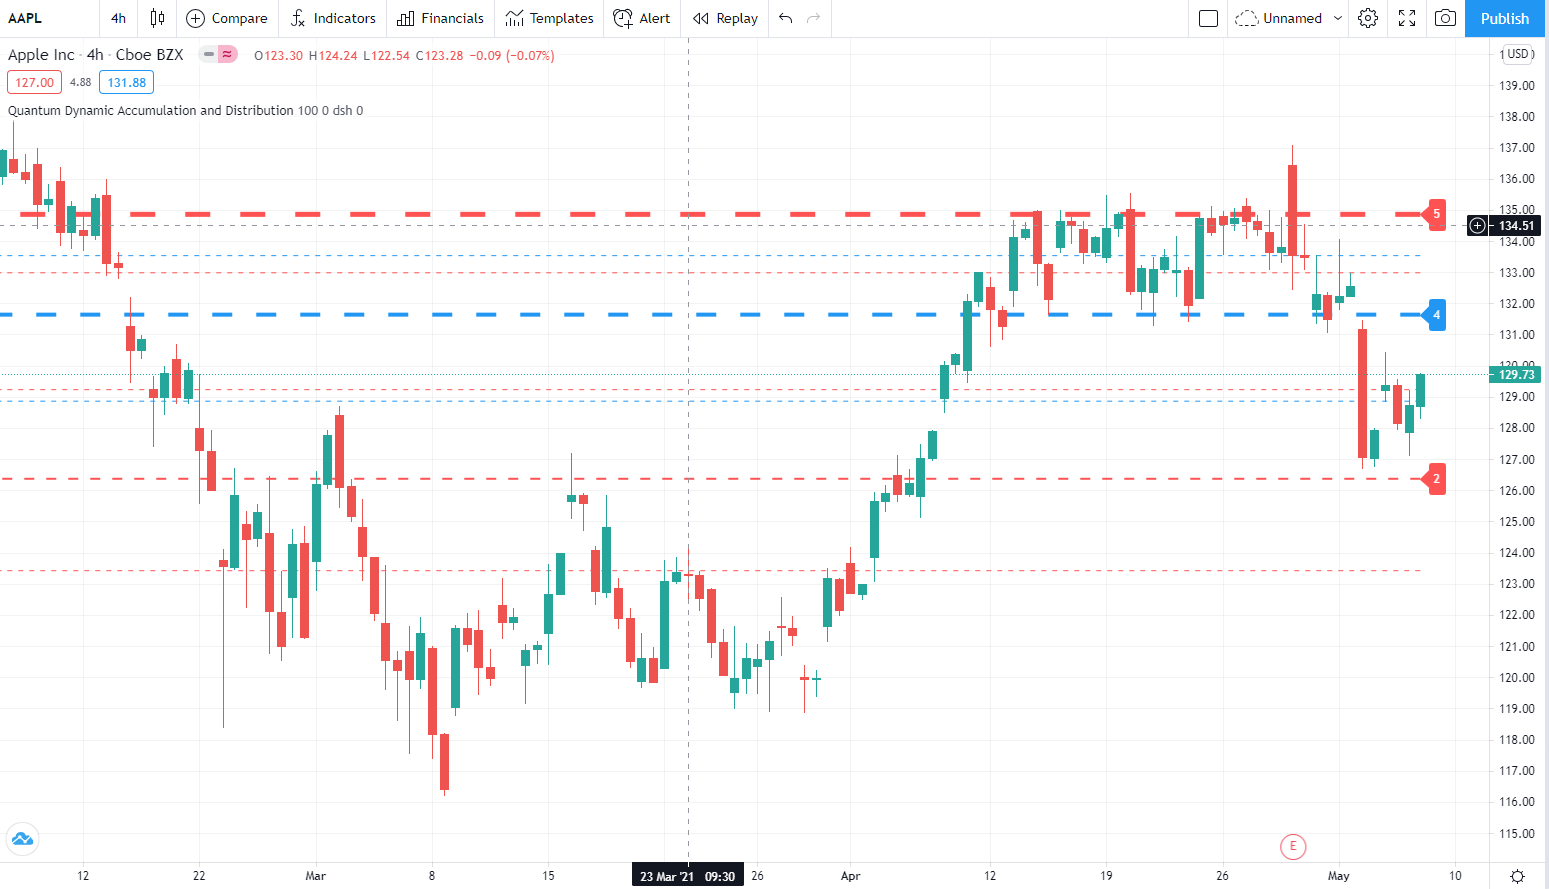 The Quantum Dynamic Support & Resistance defines these levels dynamically, in the price region you are trading – the most important region on the chart!! Why no one else has developed this approach is beyond us, but we are, of course, grateful. And we hope you will take advantage of it too. Again, the indicator is forecasting what is likely to happen in the future, not what has happened in the past!
And for additional insights into key levels, we have developed the Camarilla levels indicator which presents not four as the standard, but six levels from S6 to R6.
The Quantum TrendMonitor is yet another. Using a simple colour bar, it quite literally ‘paints the trend’ and tells you in advance when a change is on the horizon.
The Quantum Dynamic Pivots and Dynamic Volatility are two more indicators that once again provide powerful signals of where the market is heading next, not where it has been. And all of this is underpinned by our Quantum Tick Volume indicator, which, when combined with the other powerful leading indicators of price, gives you the complete picture with volume price analysis.
Finally, the dollar and yen index indicators offer further insights into market behaviour for each currency pair, and we believe that Quantum Trading is the only company currently offering a Yen index on the MT4 platform.
A full suite of indicators – but don’t worry. You can buy one at a time. Try us out as a company – test our support and most importantly, test an indicator or two. Only then, when you are completely happy, consider investing in another, or perhaps the complete suite.
We know our indicators work, because we use them ourselves – every single day in our own trading. They have been designed and developed by traders, for traders. We are constantly adding to the suite of trading indicators, and as a customer of Quantum Trading, you will receive very special discounts as these are released.