Description
Introduction
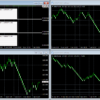
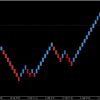
Renko is a well-known Japanese charting technique that removes the aspect of time from the chart. Instead of drawing bars in constant intervals (time) as a normal chart would, a Renko chart is built when price moves beyond a predefined price which is defined by you. This is the power a renko chart delivers to you as a trader. It reveals momentum in the market and provides a unique insight to market momentum which is then revealed directly on the chart. When the market is fast moving with price moving fast, then the Renko bars will also appear quickly, mirroring the momentum of the market. In addition, the renko chart smooths out the price action creating waterfalls of bars which are ideal for the intraday scalping trader. But at Quantum as always, we have taken the standard Renko chart and made it even better. With the Live Renko Charts indicator, not only do you get the standard option to define the renko bar size, but we have taken it a step further, giving you the option create the charts based on Average True Range (ATR). Using this option, the renko chart creates the optimal size bars based on recent price history, giving you the perfect combination. The power of Renko, combined with the optimum setting to match market momentum PERFECTLY!
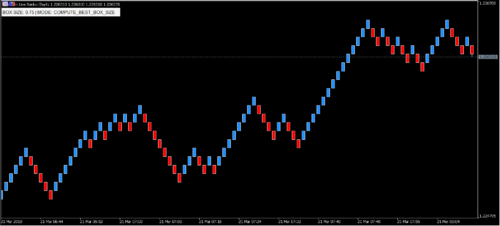
In a Renko chart, a bar is created when price exceeds the previous bar’s high or low by a predefined amount or what we like to call the Box Size. The result is a chart with equally sized bars running up or down in 45 degree angles. Such a chart offers the following major advantages:
- Effectively it filters out the noise that you would see in a normal chart
- Being based solely on price action, key support and resistance levels are more apparent
- Formation of trends are also more distinct in a Renko chart and can be used as a reliable reference for their confirmation
- Market momentum is revealed
MetaTrader 4 does not offer a facility for generating Renko charts out of the box. Because of this many scripts found on the internet were made to do just that but not quite as EFFICIENT, SIMPLE, and INTUITIVE as Quantum Trading Software’s Live Renko Charts for MetaTrader 4.
The Quantum Live Renko Charts indicator for MT4 brings all the advantages of Renko charts to your trading and more, and with the ATR option, a new and exciting level!
Live, Moving Charts
The Quantum Live Renko Charts indicator makes use of MetaTrader 4’s Offline Charts which can be conveniently accessed via the terminal’s File > Open Offline menu. Don’t be fooled though by the name of this feature as the Offline chart generated by the indicator is very much live and online.
To start using the indicator, simply drag and drop it from the Navigator to the chart as you would any other MT4 indicator. After configuring (or if you are happy with its default settings), it immediately generates an Offline chart containing the generated Renko bar chart according to your configuration.
Opening the Offline chart is easy as each instance of the Quantum Live Renko Charts indicator tells you exactly which Offline chart to look for. And of course,on opening the Offline chart, you will see that the Renko bars are completely built, not only historically but also in real-time.
Dual Mode
The Quantum Live Renko Charts indicator for MT4 features two modes:
- Compute Best Box Size
- Fixed Box Size
Compute Best Box Size
Using the indicator in this mode allows you to “convert” a normal candlestick chart to a Renko bar chart by computing the best box size for a particular timeframe. This is done by calculating the average true range (ATR) of the current symbol within a given period on a specific timeframe.
Fixed Box Size
Using the indicator in this mode allows you to set a constant box size for generating Renko bars. The box size can accept floating point numbers with a precision up to 2 decimal places.
Multiple Instances
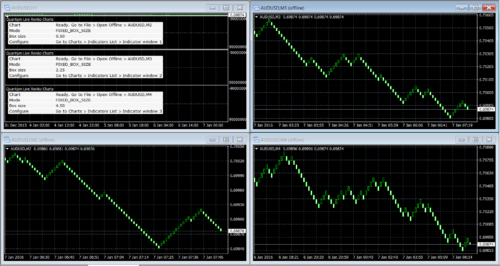
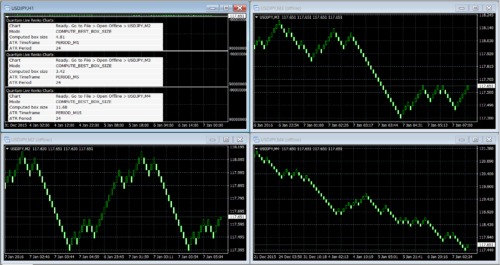
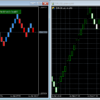
One of the biggest advantage of the Quantum Live Renko Charts indicator is its ability to be added in a single chart multiple times. Each instance of the indicator can be configured uniquely to other instances and can be easily managed by its smart labelling system, thus allowing you to save screen real estate and computer resources when building your MT4 workspace.
Context-sensitive Labels
The indicator displays labels in its own indicator window containing information about the parameters currently in effect. This allows you to properly manage all instances of the Quantum Live Renko Chart with ease.
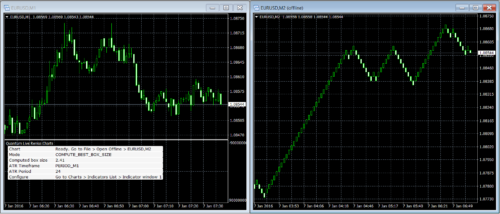
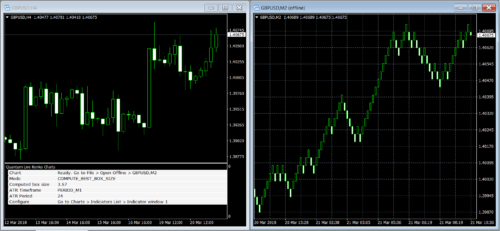
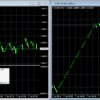
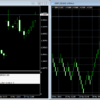
Please refer to the image above. In this example the indicator is running on COMPUTE_BEST_BOX_SIZE mode. The labels are as follows:
- Chart – Contains instructions on how to access the generated Offline chart
- Mode – Tells you which one of the two modes is active
- Computed box size – Shows the result of the average true range calculation for the best box size.
- Timeframe – Shows the timeframe used for computing the best box size
- ATR Period – Shows the number of bars to calculate the average true range
- Configure – Contains instructions on how to access the settings/inputs of an instance of the indicator
Depending on the mode selected, a different set of information is displayed.
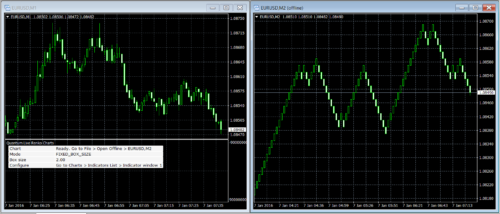
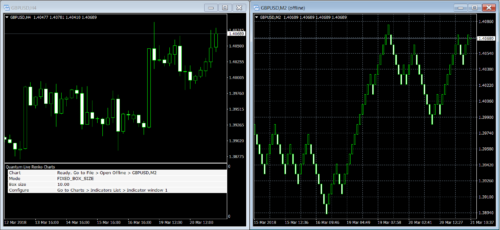
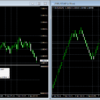
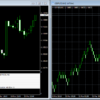
Please refer to the image above. In this example the indicator is running on FIXED_BOX_SIZE mode. The labels are as follows:
- Chart – Contains instructions on how to access the generated Offline chart
- Mode – Tells you which one of the two modes is active
- Box size – Shows the value of the Box size input which is a fixed value for creating Renko bars.
- Configure – Contains instructions on how to access the settings/inputs of an instance of the indicator
Get yours now
Make your intraday trading decisions even more quickly and efficiently and diminish risk by leveraging the power of Renko bar charts. Optimize its use even FURTHER with the new Quantum Live Renko Charts and change your day trading approach forever.

