Description
If you have been trading for a good amount of time, then you might have already heard of the word “renko” or have seen it in trading forums and passed around trader discussions and communities. It refers to a Japanese charting technique that is popular among traders because of its special way of plotting bars. It removes “time” in the equation and focuses on price action effectively baring the true direction of the market without the noise that you would normally see in a normal time-based chart.
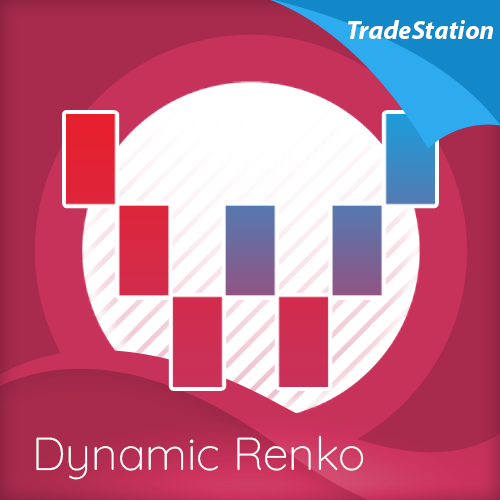
Here’s how: a bar us created when the price exceeds the previous bar’s high or low by a predefined amount or what we call the box size or brick size. This gives the renko chart a pleasant quality of having equally sized bars that are running up or down in 45-degree angles. This offers the trader some advantages.
First, it allows traders to focus solely on price as the chart filters out all minor price fluctuations and market “noise”. This makes it easier for traders not only to identify strong moves but also to spot significant turning points, and so allow traders to deploy smarter entries and exits.
Second, a renko chart then helps traders in what is probably one of the most difficult aspects of trading, namely staying in a position once a move is underway. The renko chart does this by displaying price momentum as it speeds up and slows down and it does this because a renko chart is devoid of time.
Finally, because the bricks are drawn at 45-degree angles from each other, the charts are easier to read and to analyze.
Unfortunately, the renko chart type is not always available in trading platforms and the Quantum Dynamic Renko indicator solves just that with some exciting features.
When applied, the Dynamic Renko indicator is nestled below the main chart and creates a renko chart representation of the time-based chart above. Please note that since renko charts are devoid of time so the time x-axis of the chart does not apply to the renko chart displayed. Right off the bat, the Dynamic Renko indicator takes the time-based chart above and calculates the best box size that matches the current timeframe then uses it to create the renko bars below. The computed box size is displayed at the top left-hand side of the chart in clear bold letters.
Dual Mode
The Quantum Dynamic Renko indicator for TradeStation features two modes:
- Compute Best Box Size
- Fixed Box Size
Compute Best Box Size
Using the indicator in this mode allows you to “convert” a normal candlestick chart to a renko bar chart by computing the best box size for a particular timeframe. This is computed by calculating the average true range (ATR) of the current symbol within a given period on a specific timeframe. This is displayed in the top left-hand side of the chart.
Fixed Box Size
Using the indicator in this mode allows you to set a constant box size for generating renko bars. The box size can accept floating point numbers.
Integrated Quantum Trading indicators.
The Quantum Dynamic Renko indicator for TradeStation includes the sought-after trend indicators of Quantum Trading:
- Quantum Trends indicator
- Quantum Trend Monitor indicator (lite version)
Quantum Trend Monitor indicator
The Quantum Trend Monitor has been designed to absorb temporary pauses and pullbacks. It analyses the price action, and only changes to a transitional color of dark red or dark blue, if the trend is showing a temporary sign of weakness. If it is a true change in trend direction, the indicator will change to a bright color, as the new trend develops.
The Quantum Trend Monitor displays four colours at the bottom of the screen as a solid bar:
- Bright blue – strongly bullish trend
- Bright red – strongly bearish trend
- Dark blue – weakness in bullish trend
- Dark red – weakness in bearish trend
(Please note that this version of the Trend Monitor does not include the yellow trend line mode.)
First, the Quantum Trends indicator alerts you to a possible new trend. If the trend is strong, the Quantum Trend Monitor will change to either bright blue or bright red, supporting the Trends indicator as the trend develops.
Quantum Trends indicator
The Quantum Trends indicator is the ‘sister’ indicator to the Quantum Trend Monitor. Together they go hand in hand to keep you in and surfing the trend. The Quantum Trends catches the shorter term trend, and then the Quantum Trend Monitor keeps you in for the longer term.
The Quantum Trends indicator paints a series of dots on the price chart as follows:
- Bullish trend – blue
- Bearish trend – red
- Congestion – grey
Once a new trend starts, the dots change colour dynamically, from blue to red or grey.
The Quantum Trends create the signal, its sister indicator the Quantum Trend Monitor then kicks in. Together, these two indicators provide you with the perfect tools to manage your position.
The Quantum Dynamic Renko indicator is here to fill your need for one of the most useful charting techniques right from your own TradeStation platform. Get this indicator today and open up a new door full of opportunities through the wonders of renko chart trading.