

Description
Exciting new markets require exciting new indicators and with the plethora of cryptocurrencies now available and increasingly being offered through mainstream brokers, at Quantum Trading we thought it was time for us to step in and develop something unique to help traders and investors trading the new kids on the block.
Cryptocurrencies like their more established cousins in forex, are in a constant state of flux moving from overbought to oversold and back again, but at a much faster pace, and generally associated with volatility. The challenge of course is picking those phases of price action where these conditions have been met and so offering the trader two opportunities. Either to take a position ahead of any reversal and so get in early before the trend develops, or alternatively to wait until the trend is underway and then jump in. You can think of this as a train in the station. Do you board early before it leaves, or jump aboard once it is underway? Both approaches have advantages and disadvantages, but the choice is yours.
So, our development team set to work to deliver the perfect indicator to deliver this information for you visually and quickly, and we are proud to announce the Cryptocurrency Strength Indicator or the CCSI for short. And if you thought this looks similar to its hugely popular currency strength indicator for forex then you would be right.
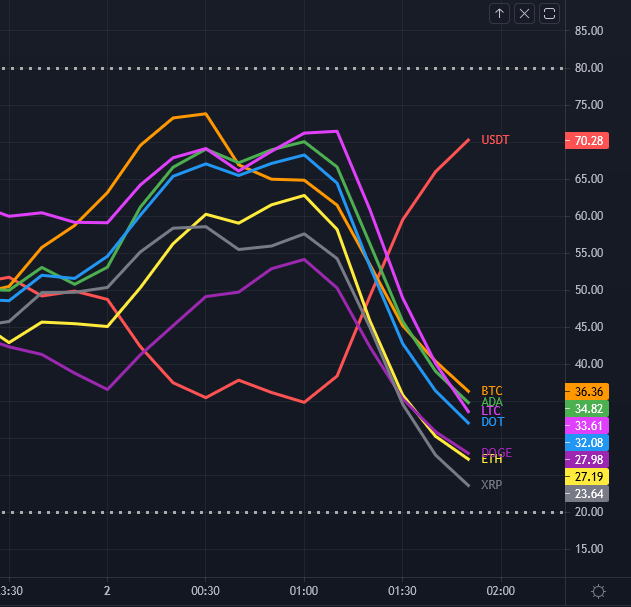
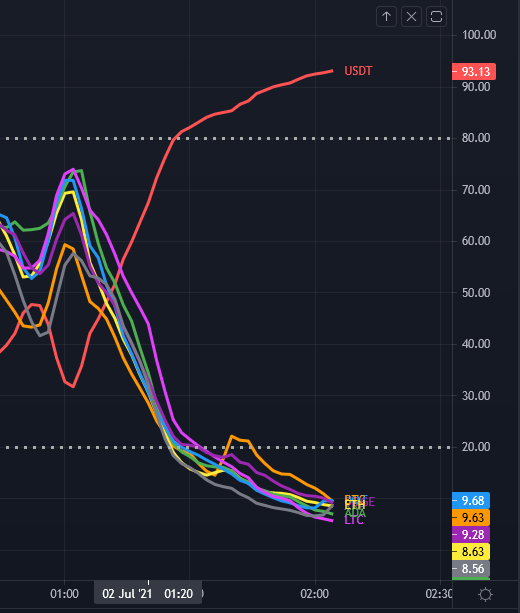
This indicator is of course a little different, though the principles of how to use it can be considered the same. So how does it work? Well, first of all, here we are dealing with a cryptocurrency pair, rather than isolating out the currency itself, as every cryptocurrency is quoted against the USD in some way. In these markets we are seeing the movement of the cryptocurrency against the US dollar and in developing the indicator we have chosen to display this against Tether. In other words, USDT.
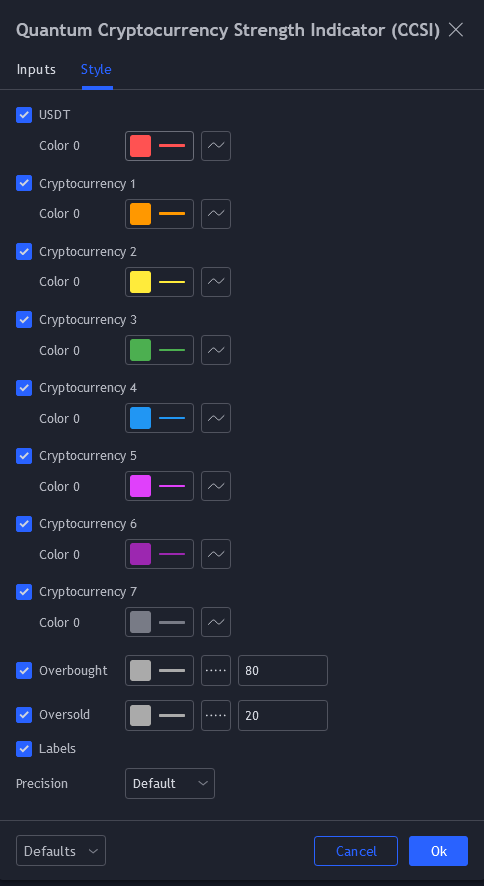
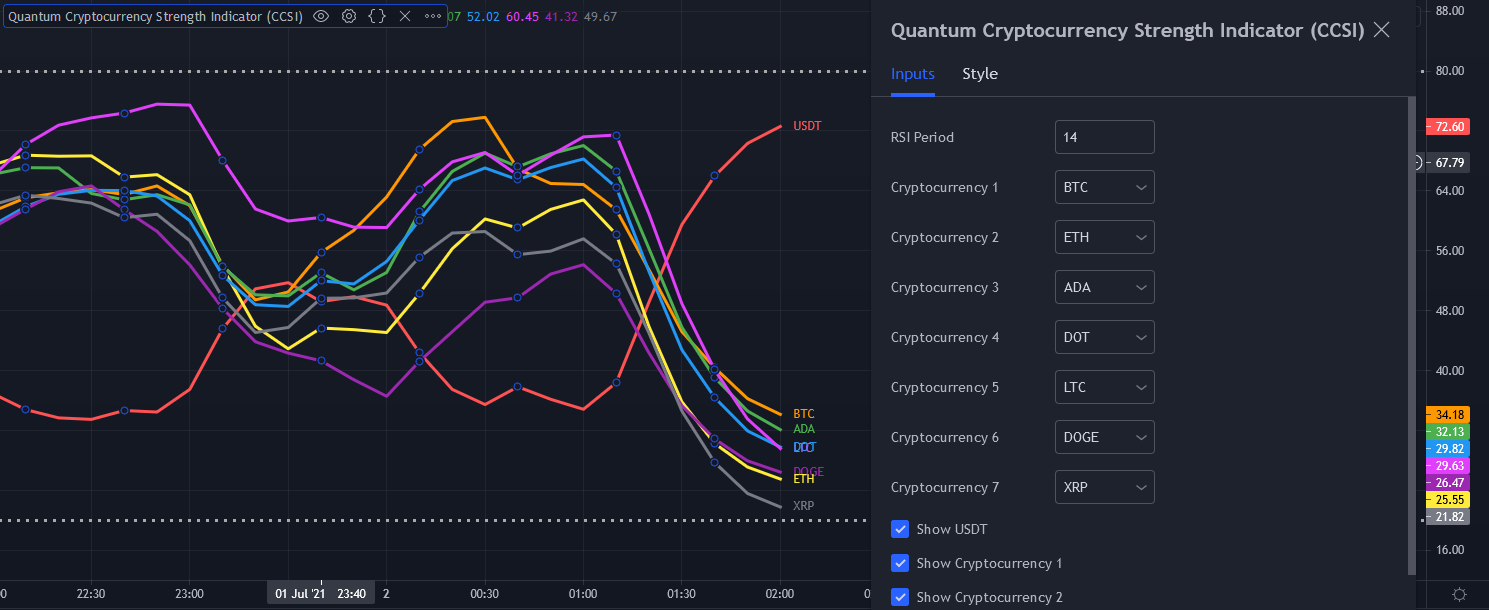
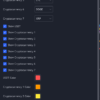
The indicator displays seven of the most popular cryptocurrencies against the USDT, but what we have also included in the design is the option to deselect these and select others of your choice, so you have complete control of those cryptocurrencies you wish to trade. In addition, we understand that alerts are a hugely popular function of the TradingView platform, so we have added these in these also. And of course, as you would expect we have included the option to isolate out those of interest. So how do we use the indicator?
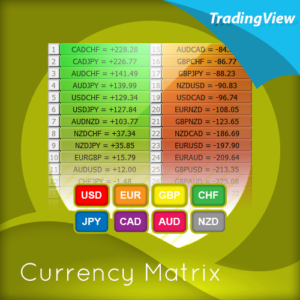
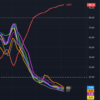
First, as you might expect, the cryptocurrency market tends to move ‘en mass’ – in other words generally either moving higher or lower together. You can think of this as an equivalent to the currency matrix in forex, where currencies of one denomination, such as the yen will all move in the same direction if the yen is being bought or sold universally. It is the same here. On occasion, on the faster timeframes, one does see divergence, but as a general rule, they will all tend to move together which is great as it gives you the confidence you are trading in the direction of the entire market. What is important however is the direction of the USDT. This will ALWAYS be in the opposite direction which is why we isolate it out from the others, to reveal precisely how this is moving. Remember, what drives a strong trend is when one currency is rising and another falling in forex and it is exactly the same here. When the USDT is rising strongly and the cryptocurrencies are falling, then a strong trend is underway. Equally, if the USDT is falling strongly then you will see a strong trend in your chosen cryptocurrency.
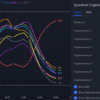
Next, we look for overbought and oversold opportunities in precisely the same way as for the currency strength indicator. Cryptocurrencies are in a constant state of flux moving from oversold to overbought and back again in all timeframes so there are always plenty of opportunities to employ this tactic and get in early at the start of a new trend. The angle of inclination of the line reveals the strength of the move, but equally, if the cryptocurrencies are moving sideways along with the USDT then we have to wait and be patient. But the beauty of this market is that it genuinely trades twenty-four hours a day, and seven days a week. Trend trading is another great tactic and as soon as the move is underway you can jump on the moving train and join a current trend and with cryptocurrencies, you don’t normally have to wait long as the price action is constant.
However, don’t just think of the Cryptocurrency Strength Indicator as a tool for simply getting you in. It will also help you to stay in and get out at the right time. After all if it’s good enough to get you in then it’s good enough to keep you in also. But remember, when the lines are moving sideways along with the USDT, then it’s a question of being patient and waiting. In other words, it helps to keep you out too.
The indicator works in all timeframes on the TradingView platform from seconds and upwards, so all trading approaches and tactics are catered for with this indicator. It can be used with any instrument whether through a conventional broker or for trading binary options which are extremely popular, and of course cryptocurrency futures too.